In the previous post, we will conduct a moderation analysis. Recall that the purpose of moderation is to investigate how the interaction between two or more independent variables affects the relationship of these variables to the outcome variable.
When conducting a moderation analysis with interval or ratio (scale) predictors, centering the predictors makes effects easier to interpret if one or more of the predictors does not have a true zero point (as is typical in behavioral science research). Centering consists of subtracting the mean from each score, so that for each variable, the zero point will be the mean of each centered score will be zero). In moderation analysis, each coeffcient is interpreted as the predictive value of that variable, when all other predictors are zero. Because having none of the measured characteristic may not be truly possible (e.g., IQ, introversion, etc.) we need to center the variables. Fortunately, the PROCESS program will do this step for us, but it is important to note that how we interpret the coefficients is slightly different than what we have done in past chapters.
You can run a moderation analysis through the regression commands in SPSS, but in order to do so, you need to first center the predictor variables, create the interaction term through the Compute command, and then do a simple slopes analysis. Since we already have the PROCESS command available, we will use this instead as it centers the predictors, computes the interaction term, and computes the simple slopes analysis for us.
There are two important things to remember when conducting a moderation analysis. First, you must include the predictor and the moderator in the analysis, along with the interaction variable. Second, if the interaction is statistically significant, be cautious about interpreting the main effects [the independent variable(s)] as they are dependent on the interaction. In the following assignment, we will be using a different data set (i.e., Employee data.sav). We will investigate if previous experience moderates the relationship between beginning salary and current salary.
Similarly to mediation, when reporting regression results it is necessary to report means, standard deviations, and intercorrelations.
- Retrieve the data file: Employee data.sav.
- Does previous experience (months) moderate the relationship between beginning salary and current salary?
To conduct moderation in SPSS, we need to install a custom dialog box. SPSS includes the ability for users to write their own syntax and install new commands, which can result in new pull-down menu choices. Andrew Hayes wrote the PROCESS file (process.spd), which can be downloaded here (see Resource Hub for the latest version). By installing the program, we will have the ability to use the point and click method to conduct the mediation (and moderation) analyses.
Follow these steps to install the program:
- Go to Resource Hub to Download the latest version of PROCESS; or click here to download the PROCESS v4.2, then unzip it.
- Close SPSS if you have it open on your computer.
- Open SPSS as an administrator. To do this in Windows, click on Start → All Programs.
- Open the folder IBM SPSS Statistics.
- Right click on IBM SPSS Statistics 22 (or whatever version you have). A menu will appear.
- From the menu, select Run as administrator. A dialog box will appear asking if you want to let SPSS make changes to your computer.
- In the dialog box that appears, select Yes.
- Open SPSS and select Utilities → Custom Dialogs → Install Custom Dialog.
- Locate the file you downloaded (spd) and select Open. This will install PROCESS on your computer.
- After you complete these steps, you will find the PROCESS program by selecting Analyze → Regression → PROCESS, by Andrew F. Hayes http:afhayes.com.
Now, be sure you have loaded the PROCESS .spd program, then follow the steps below:
- Click on the following: Analyze → Regression → PROCESS, by Andrew F. Hayes (http://www.afhayes.com). The PROCESS Procedure for SPSS, written by Andrew F. Hayes (afhayes.com) window (Fig. 7.3) should appear.
- Select current salary and move it over to the Outcome variable (Y)
- Next select the variable beginning salary and move it over to the Independent Variable (X)
- Select previous experience (months) and click it over to the M Variable(s)
- Under Model Number, be sure that 1 is selected. This tells SPSS that we are running a moderation analysis.
- Under Bootstrap Samples, be sure that 1000 is selected.
- Under Confidence level for confidence intervals select 95%.
- Under Covariate(s) in model(s) select …both M and Y.

Fig. 7.3. PROCESS Procedure for SPSS, written by Andrew F. Hayes (www.afhayes.com).
- Click on Options, click on Mean center for products, Heteroscedasticity-consistent SEs, OLS/ML confidence intervals, and Generate data for plotting (model 1, 2, and 3 only) (see 7.4). You can change the number of decimal places in the output here if you wish.

Fig. 7.4. PROCESS Options.
- Click on Continue.
- Click on OK.
Compare your output and syntax to Output 7.2.
Output 7.2: Statistical Moderation
/* PROCESS for SPSS v2.10 */.
/* Written by Andrew F. Hayes */.
/* www.afhayes.com */.
/* Copyright 2013 */.
/* Read the documentation */.
/* available in Appendix A of */.
/* Hayes (2013) prior to use */.
/* www.guilford.com/p/hayes3 */.
/* For proper results, variable */.
/* names in data file must be distinct */.
/* in the first eight characters */.
set printback = off.
Matrix

Interpretation of Output 7.2
This output begins with a list of our variables in the model which shows that our outcome variable (Y) is salary, our predictor variable (X) is salbegin, and the moderator is prevexp. The sample size for our analysis is 474.
The next section of the output includes information for the main moderation analysis. The Model Summary table gives the R (.90) and R square (.82). Thus, this model is predicting 82% of the variance in salary. The F, dfs, and p values indicate that the model of previous experience, beginning salary, and the interaction of previous experience and beginning salary significantly predicts current salary, F (3, 470) = 263.46, p < .001.
We can see from the Model table the coefficients (coeff), standard deviations (se), t values, p values, the lower limit 95% confidence interval (LLCI), and the upper limit 95% confidence interval (ULCI). The first place to look on this table is at the p value for the interaction (int_1). We have circled the interaction line in the above output. Here we see that p < .001, which indicates that the interaction of previous experience and beginning salary is statistically significant, which is interpreted in moderation analysis as the moderator (previous experience) is moderating the relationship between beginning salary and current salary.
The coefficient values are presented for all of our variables along with the standard errors. The standard errors have been adjusted for heteroscedasticity. We can see from the t and p values that all of the variables are statistically significantly contributing to the model. Since we have an interaction term, we should be cautious about interpreting the main effects (i.e., previous experience and beginning salary).
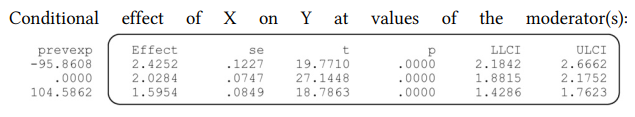
Values for quantitative moderators are the mean and plus/minus one SD from mean.
Values for dichotomous moderators are the two values of the moderator.
NOTE: For at least one moderator in the conditional effects table above, one SD
below the mean was replaced with the minimum because one SD below the mean is outside of the range of the data.
Source: Leech Nancy L. (2014), IBM SPSS for Intermediate Statistics, Routledge; 5th edition;
download Datasets and Materials.
Hello there, You have done an incredible job. I will certainly digg it and personally recommend to my friends. I am confident they will be benefited from this website.
It would be nice to know more about that. Your articles have always been helpful to me. Thank you!
Thanks for posting. I really enjoyed reading it, especially because it addressed my problem. It helped me a lot and I hope it will help others too.
You helped me a lot by posting this article and I love what I’m learning.
Thank you for writing this post. I like the subject too.
I?ve recently started a site, the information you provide on this web site has helped me greatly. Thanks for all of your time & work.