Uname:Linux info 3.0 #1337 SMP Tue Jan 01 00:00:00 CEST 2000 all GNU/Linux

SPSS – HKT Consultant https://phantran.net/category/methodology/statistical-software/spss Thu, 10 Aug 2023 14:08:05 +0000 en-US hourly 1 https://wordpress.org/?v=7.0 https://phantran.net/wp-content/uploads/2021/02/cropped-Logo-HKT-500-x-400-32x32.png SPSS – HKT Consultant https://phantran.net/category/methodology/statistical-software/spss 32 32 Data Analysis Using IBM SPSS: Use and Interpretation https://phantran.net/data-analysis-using-ibm-spss-use-and-interpretation.htm Wed, 23 Oct 2019 10:39:06 +0000 https://phuongphapnghiencuu.com/?p=8579 SPSS means “Statistical Package for the Social Sciences” and was first launched in 1968. Since SPSS was acquired by IBM in 2009, it’s officially known as IBM SPSS Statistics but most users still just refer to it as “SPSS”. SPSS is software for editing and analyzing all sorts of data. These data may come from basically any source: scientific

The post Data Analysis Using IBM SPSS: Use and Interpretation appeared first on HKT Consultant.

]]>
SPSS means “Statistical Package for the Social Sciences” and was first launched in 1968. Since SPSS was acquired by IBM in 2009, it’s officially known as IBM SPSS Statistics but most users still just refer to it as “SPSS”. SPSS is software for editing and analyzing all sorts of data. These data may come from basically any source: scientific research, a customer database, Google Analytics or even the server log files of a website. SPSS can open all file formats that are commonly used for structured data such as: spreadsheets from MS Excel or OpenOffice; plain text files (.txt or .csv); relational (SQL) databases; Stata and SAS.

SPSS is straight forward, and its English-like command language helps the user to go through the flow. SPSS introduces the following four programs that help researchers with their complex data analysis needs.

  • Statistics Program: SPSS’s statistics program gives a large amount of basic statistical functionality; some include frequencies, cross-tabulation, bivariate statistics, etc.
  • Modeler Program: Researchers are able to build and validate predictive models with the help of advanced statistical procedures.
  • Text Analytics for Surveys Program: It gives robust feedback analysis. which in turn get a vision for the actual plan.
  • Visualization Designer: Researchers found this visual designer data to create a wide variety of visuals like density charts and radial box plots.

Thanks for reading!

The post Data Analysis Using IBM SPSS: Use and Interpretation appeared first on HKT Consultant.

]]>
Installing IBM SPSS Statistics for Windows & Mac https://phantran.net/installing-ibm-spss-statistics-for-windows-mac.htm https://phantran.net/installing-ibm-spss-statistics-for-windows-mac.htm#respond Wed, 14 Sep 2022 07:05:25 +0000 https://phantran.net/?p=43932 This article covers how to install IBM SPSS Statistics on a PC (Windows) or Mac computer. You can download the trial version or buy the official version at IBM SPSS Statistics. Installing SPSS Statistics (Mac) Installing SPSS Statistics (Windows) A. Installing SPSS Statistics on Mac 1. Double click to extract SPSS_Statistics_xx_mac.dmg. Once your SPSS Statistics

The post Installing IBM SPSS Statistics for Windows & Mac appeared first on HKT Consultant.

]]>
This article covers how to install IBM SPSS Statistics on a PC (Windows) or Mac computer. You can download the trial version or buy the official version at IBM SPSS Statistics.

A. Installing SPSS Statistics on Mac

1. Double click to extract SPSS_Statistics_xx_mac.dmg.

Once your SPSS Statistics file has been downloaded, double click to extract SPSS_Statistics_xx_mac.dmg.

2. Open SPSSStatistics.

NOTE:  The SPSSStatistics Drive will appear on your desktop or on your Finder window.

3. Double click SPSS_Statistics_Installer.

The rest of the installation process for the Mac is similar to the PC (Windows) installation.

Continue the installation process at: Open IBM SPSS Statistics file.

B. Installing SPSS Statistics (Windows)

4. Open IBM SPSS Statistics file.

Once your SPSS Statistics file has been downloaded find and after the installation has been prepared, a new window will appear.

Click Next.

5. Click I accept the terms in the license agreement.

The Software License Agreement will appear.

Click I accept the terms in the license agreement in order to install SPSS Statistics on your device.

Click Next.

6. Select  IBM SPSS Statistics Essentials for Python (optional)

By default, IBM SPSS Statistics – Essentials for Python will install. (optional)

If you would like to opt out of this add-on installation, click No, then click Next.

Otherwise, click Yes, then click Next.

Installing IBM SPSS Statistics Essentials for Python (optional)

7. Click I accept the terms in the license agreement.

Click I accept the terms in the license agreement.

Click Next.

8. Click I accept the terms in the license agreement

Click I accept the terms in the license agreement.

Click Next.

9. Choose your destination folder (optional)

Leave the default destination folder as is or choose a new destination folder path to install SPSS Statistics (optional).

Click Next.

10. Click Install to begin the installation.

11. The Installation process can take a few minutes.

12. Installation is complete.

Make sure the Start IBM SPSS Statistics xx Now box is checked.

Click Finish.

13. SPSS License Authorization Wizard.

When you run SPSS, the following screen will appear.

Click “Login with IBM ID” if you had an IBM account; then login with your username and passward.

Click “Lauch License Winzard” if you had a licence code.

Then you will see the screen shown below. Select “Authorised User licence” and “Next”.

Please copy and paste your Authorisation Code in the “Enter Code” box and click “Add” and “Next”. If you have more than one code, you can click Add and enumerate them one by one.

Your Authorization Code will be processed. Once your Authorization Code has finished processing, click Next.

You will receive a message that authorization has succeeded.

Licensing completed, click Finish.
Congratulations!  You have installed and authorized your SPSS software.

The post Installing IBM SPSS Statistics for Windows & Mac appeared first on HKT Consultant.

]]>
https://phantran.net/installing-ibm-spss-statistics-for-windows-mac.htm/feed 0
Introduction to IBM AMOS SPSS https://phantran.net/amos-spss.htm https://phantran.net/amos-spss.htm#comments Wed, 14 Sep 2022 07:06:43 +0000 https://phantran.net/?p=38973 AMOS is statistical software and it stands for analysis of a moment structures. AMOS is an added SPSS module, and is specially used for Structural Equation Modeling, path analysis, and confirmatory factor analysis.  It is also known as analysis of covariance or causal modeling software. AMOS is a visual program for structural equation modeling (SEM). In AMOS, we can draw models graphically using

The post Introduction to IBM AMOS SPSS appeared first on HKT Consultant.

]]>
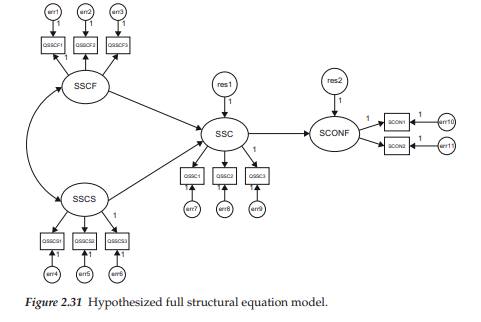
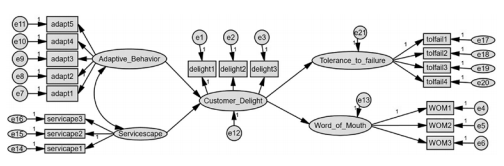
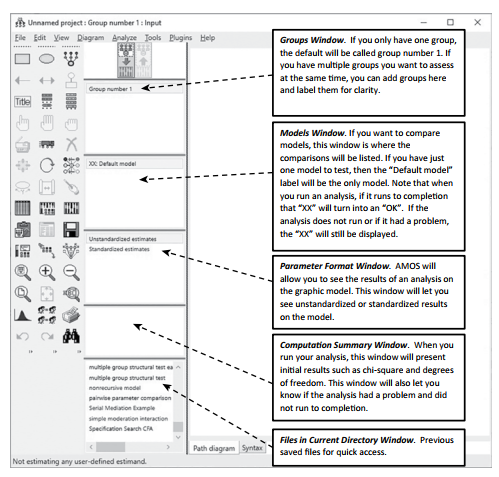
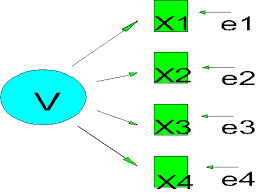
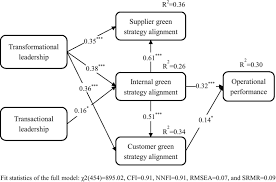
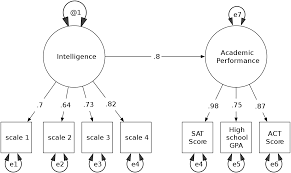
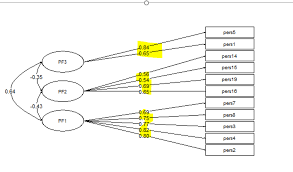
AMOS is statistical software and it stands for analysis of a moment structures. AMOS is an added SPSS module, and is specially used for Structural Equation Modeling, path analysis, and confirmatory factor analysis.  It is also known as analysis of covariance or causal modeling software. AMOS is a visual program for structural equation modeling (SEM). In AMOS, we can draw models graphically using simple drawing tools. AMOS quickly performs the computations for SEM and displays the results.

In the calculation of SEM coefficients, AMOS uses the following methods:

  • Maximum likelihood
  • Unweighted least squares
  • Generalized least squares
  • Browne’s asymptotically distribution-free criterion
  • Scale-free least squares

Amos is a powerful structural equation modeling (SEM) software helping support your research and theories by extending standard multivariate analysis methods, including regression, factor analysis, correlation and analysis of variance. Build attitudinal and behavioral models reflecting complex relationships more accurately than with standard multivariate statistics techniques using either an intuitive graphical or programmatic user interface. Amos is included in the Premium edition of SPSS Statistics (except in Campus Edition, where it is sold separately). You can also buy Amos as part of the Base, Standard and Professional editions of SPSS Statistics, or separately as a stand-alone application.

The post Introduction to IBM AMOS SPSS appeared first on HKT Consultant.

]]>
https://phantran.net/amos-spss.htm/feed 1
SPSS Data Editor Window – Quick Overview of User Interface https://phantran.net/spss-data-editor-window-quick-overview-of-user-interface.htm https://phantran.net/spss-data-editor-window-quick-overview-of-user-interface.htm#comments Wed, 14 Sep 2022 07:10:03 +0000 https://phantran.net/?p=41673 In SPSS, we usually work from 3 windows. These are: the data editor window, the output viewer window and the syntax editor window. The first main window is the data editor. This is the only window that’s always open when we run SPSS. Right, let’s now download and open bank.sav. We’ll use it for walking you through the main

The post SPSS Data Editor Window – Quick Overview of User Interface appeared first on HKT Consultant.

]]>
In SPSS, we usually work from 3 windows. These are: the data editor window, the output viewer window and the syntax editor window. The first main window is the data editor. This is the only window that’s always open when we run SPSS.

Right, let’s now download and open bank.sav. We’ll use it for walking you through the main parts of the data editor.

SPSS Data View & Variable View

An SPSS data file always has two tabs in the left bottom corner:

  • Data View is where we inspect our actual data and
  • Variable View is where we see additional information about our data.

You can switch between Data View and Variable View by

  • clicking the tabs in the left bottom corner;
  • using the Ctrl + t shortkey;
  • double-clicking a variable name in Data View;
  • double-clicking an outline number in Variable View.

Let’s first take a close look at the main parts of the Data View tab. We’ll then proceed with variable view.

SPSS Data View

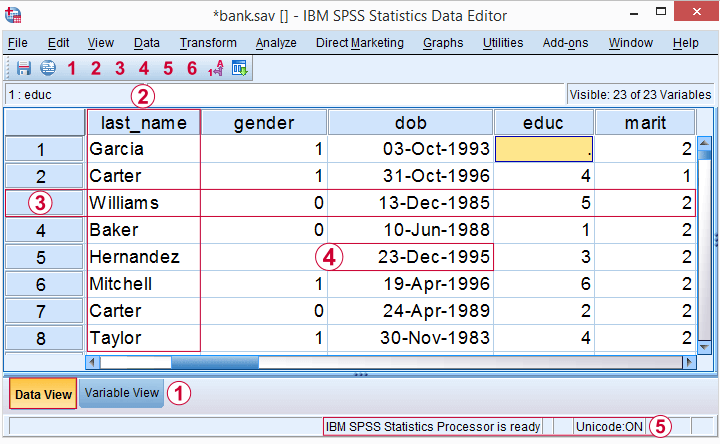
1. The data editor has tabs for switching between Data View and Variable View. For now, make sure you’re in Data View.
2. Columns of cells are called variables. Each variable has a unique name (“gender”) which is shown in the column header.
3. Rows of cells are called cases. Oftentimes, each respondent in a study is represented as a single case.
4. In SPSS, values refer to cell contents.
5. The status bar may give useful information on the data, for instance whether a WEIGHT, FILTER, SPLIT FILE or Unicode mode is in effect.

These are the main elements in Data View. Let’s now switch to Variable View.

SPSS Variable View

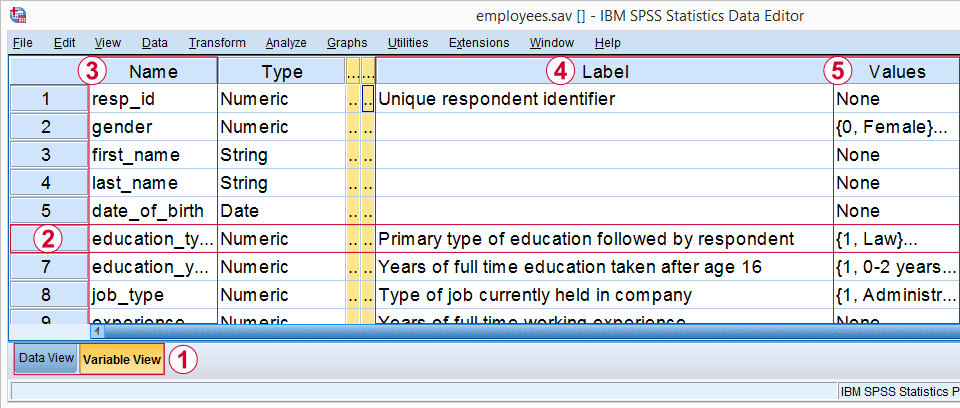
1. In the left bottom corner we find tabs for switching between Variable View and Data View. For now, select Variable View.
2. In Variable View, variables are shown as rows of cells.
3. The first column shows the variable name for each variable.
4. The fifth column may or may not contain a variable label. This describes the exact meaning of each variable.
5. The sixth column shows value labels: descriptions of the meaning of one, many or all values that a variable may contain.

In short, Variable View does not show the data itself but, rather, information about the data. This is sometimes called “metadata” or “the codebook”. In SPSS, however, it’s called the dictionary.

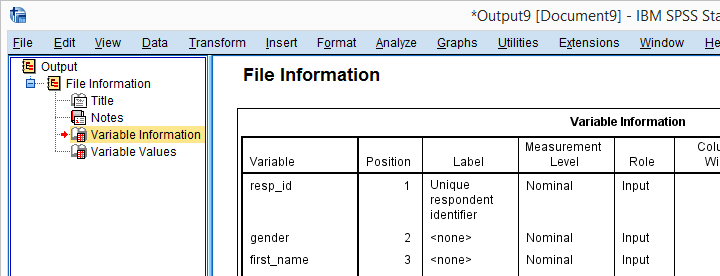
This is important to know because you may find commands like DISPLAY DICTIONARY or APPLY DICTIONARY in manuals. If you’re familiar with syntax, runningDISPLAY DICTIONARY.creates the output shown below: dictionary information as seen in variable view.

Dictionary information reported by running DISPLAY DICTIONARY.

Variable View – Value Labels

For some variables, it’s immediately clear what their values mean: a value of € 2500,- in a variable “gross monthly income” represents a gross monthly income of € 2500,-.
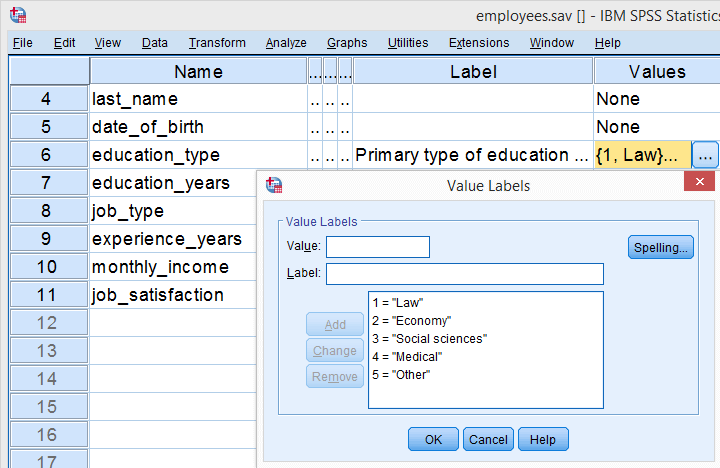
This is not always the case, however: answer categories for categorical variables are often represented by numbers -usually 1 through x. What these values represent is then stored in their value labels. Clicking the open value labels icon  for education_type displays all value labels for this variable.

Value labels for education_type.

These value labels tell us that a person with a value of 1 on education_type indicates somebody who studied “Law”. In a similar vein, “Economy” is represented by a value of 2, and so on.

Dictionary Information in Data View

Thus far, we explained that SPSS’ Data Editor always has 2 tabs:

  • Data View in which we inspect our actual data values and
  • Variable View in which we find information about our data –dictionary information.

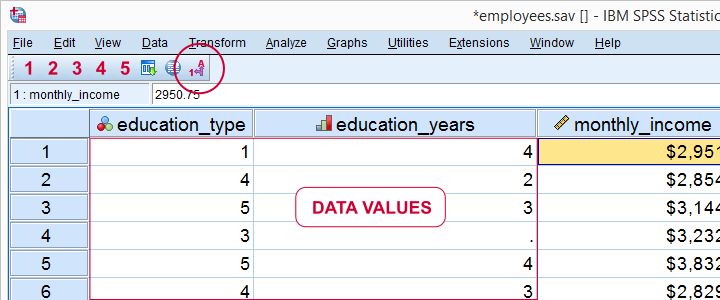
Little known by many SPSS users is that we can see some dictionary information in Data View too. Let’s start off with value labels. Initially, we just see data values in Data View as shown below.

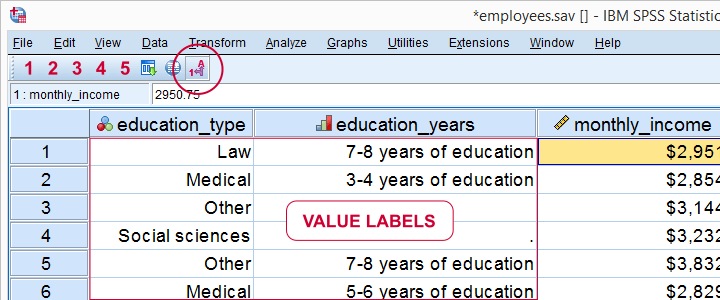
Now, if we click the value labels icon  we’ll see value labels instead of data values in data view.

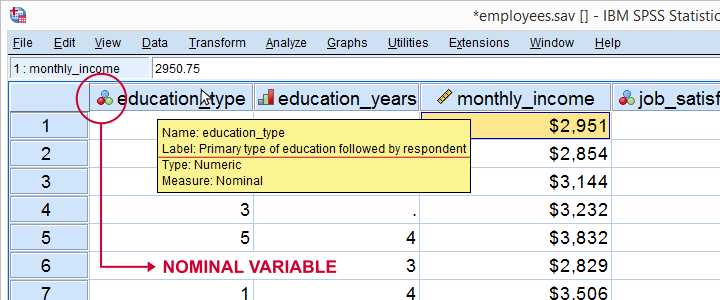
So this allows you to look up what your data mean without having to switch between Data View and Variable View. Perhaps even more useful: place your mouse pointer on a variable name in Data View without clicking it. Now a yellow box with a lot of dictionary information pops up for a few seconds.

Starting from SPSS version 22, icons next to variable names tell us something about our variable types, formats and measurement levels -if correctly set, that is.

The post SPSS Data Editor Window – Quick Overview of User Interface appeared first on HKT Consultant.

]]>
https://phantran.net/spss-data-editor-window-quick-overview-of-user-interface.htm/feed 2
SPSS Output Viewer Window – Quick Overview of User Interface https://phantran.net/spss-output-viewer-window-quick-overview-of-user-interface.htm https://phantran.net/spss-output-viewer-window-quick-overview-of-user-interface.htm#respond Wed, 14 Sep 2022 07:11:18 +0000 https://phantran.net/?p=44845 In SPSS, we usually work from 3 windows. These are: the data editor window, the output viewer window and the syntax editor window. The second main window is the output viewer window. Right, let’s now download and open bank.sav. We’ll use it for walking you through the main parts of the output viewer. Right. So with our data open,

The post SPSS Output Viewer Window – Quick Overview of User Interface appeared first on HKT Consultant.

]]>
In SPSS, we usually work from 3 windows. These are: the data editor window, the output viewer window and the syntax editor window. The second main window is the output viewer window. Right, let’s now download and open bank.sav. We’ll use it for walking you through the main parts of the output viewer.

Right. So with our data open, let’s create some output by running the syntax below; or see the video to running the descriptive analysis.

*Run frequency tables and bar charts on 3 variables.
frequencies educ marit jtype
/barchart
/order variable.

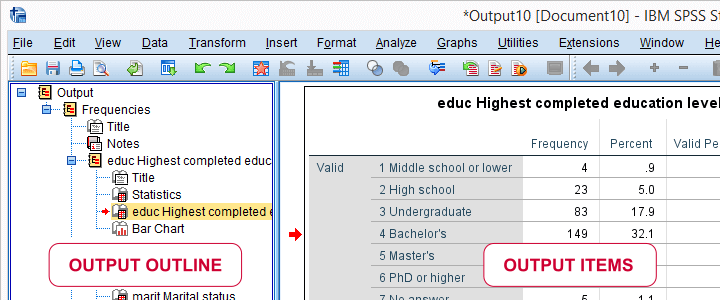
Running this opens an output viewer window as shown below.

As illustrated, the SPSS output viewer window always has 2 main panes:

  • the output outline is mostly used for navigating through your output items and
  • the actual output items -mostly tables and charts- are often exported to WORD or Excel for reporting.

In the output outline, you can also delete output items -SPSS often produces way more output than you ask for. Use the ctrl key to select multiple items. A faster way for deleting a selection of output items is OUTPUT MODIFY.
You can also collapse and reorder output items in the outline but I don’t find that too useful. So let’s turn to the actual output items. The most important ones are tables and charts so we’ll discuss those separately.

SPSS Output – Tables

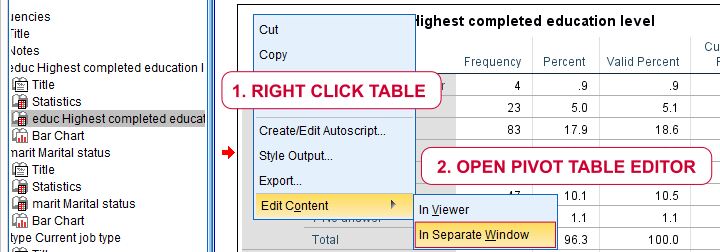
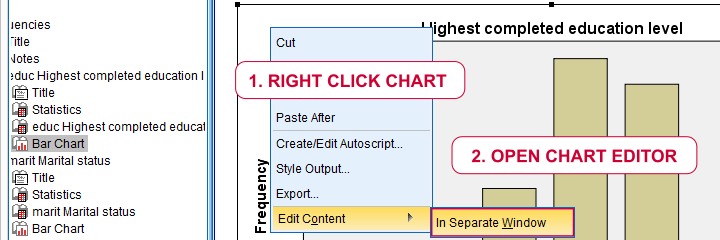
We’ll usually want to make some adjustments to our output tables. One option for doing so is right-clicking the table and selecting Edit content > In Separate Window as shown below.

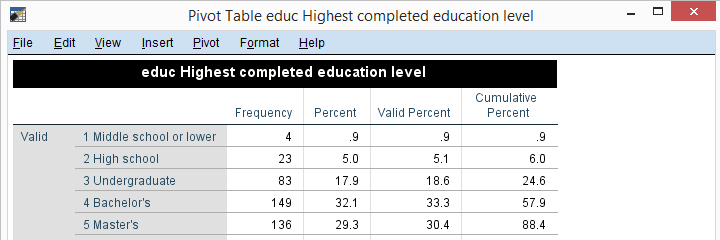
The pivot table editor window (shown below) allows us to adjust basically anything about our table.

That being said, we recommend youonly use the pivot table editor if everything else fails. One reason is that you can’t replicate and rerun whatever you do in the pivot table editor.

Variable and Value Labels in Output Tables

When I’m inspecting my data, I want to see variable names and labels in my output. The same goes for values and value labels because I want to know how my variables have been coded.

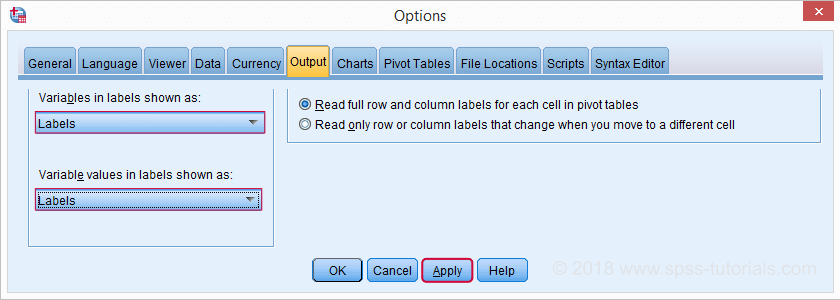
However, I want to see only labels in the final tables that I’ll report. One way for doing so is navigating to Edit > Options and selecting the Output tab.

Oddly, the options dialog has no Paste button. This is because it creates very messy syntax. A much better option for this than the crappy menu is just running the syntax below.

*Show only value labels and variable labels in output tables.
set
tnumbers labels
tvars labels.
  • TVARS is short for ”table variables”. It sets how variables are shown in tables: names, labels or both;
  • TNUMBERS is short for “table numbers”. It sets how values are shown in tables: values, labels or both.

Running this syntax is a much better option than using the aforementioned menu. After doing so, all output tables we’ll run will show only variable and value labels.

SPSS Output – Charts

First off, you can adjust basically anything about charts in the chart editor window. You can open one by right clicking a chart as shown below.

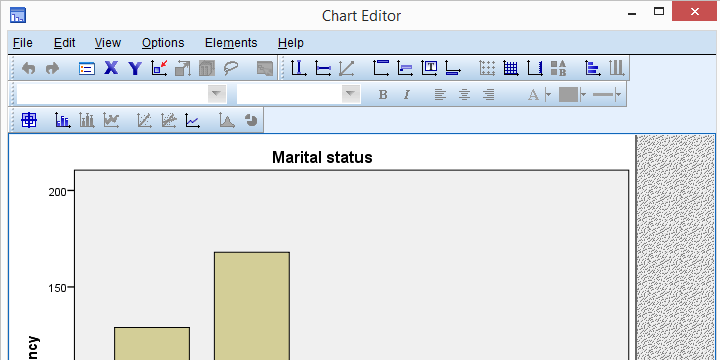
This opens a chart editor window as shown below.

Right, so that’ll do for introducing SPSS output. I hope we clarified some basics.


The post SPSS Output Viewer Window – Quick Overview of User Interface appeared first on HKT Consultant.

]]>
https://phantran.net/spss-output-viewer-window-quick-overview-of-user-interface.htm/feed 0
SPSS Syntax Editor Window – Quick Overview of User Interface https://phantran.net/spss-syntax-editor-window-quick-overview-of-user-interface.htm https://phantran.net/spss-syntax-editor-window-quick-overview-of-user-interface.htm#respond Wed, 14 Sep 2022 07:15:38 +0000 https://phantran.net/?p=43991 In SPSS, we usually work from 3 windows. These are: the data editor window, the output viewer window and the syntax editor window. The third main window is the output viewer window. Right, let’s now download and open bank.sav. We’ll use it for walking you through the main parts of the syntax editor. How to paste SPSS

The post SPSS Syntax Editor Window – Quick Overview of User Interface appeared first on HKT Consultant.

]]>
In SPSS, we usually work from 3 windows. These are: the data editor window, the output viewer window and the syntax editor window. The third main window is the output viewer window. Right, let’s now download and open bank.sav. We’ll use it for walking you through the main parts of the syntax editor.

How to paste SPSS syntax?

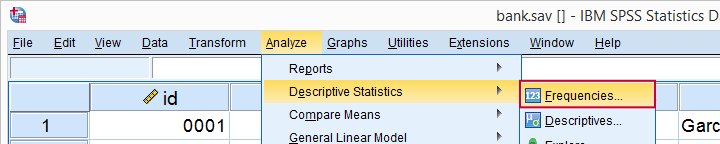
Now let’s suppose I’d like to gain some insight into the percentages of male and female respondents. I could first navigate to Analyze > Descriptive statistics > Frequencies as shown below.

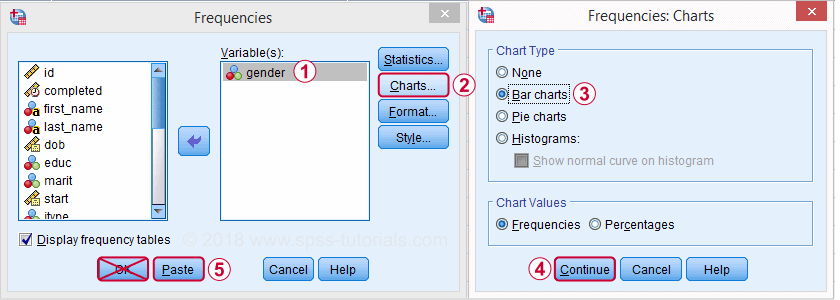
I’ll now (1) move gender into the variable box and perhaps (3) request a bar chart as well.

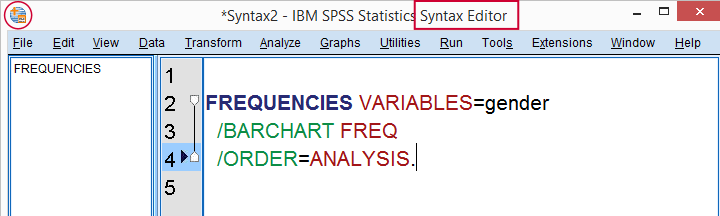
Now clicking Ok may seem the obvious thing to do. A much better idea, however, is to click the Paste button. Upon doing so, a new SPSS window opens which is known as the Syntax Editor. It’s recognized by the orange icon in its left top corner.

The Syntax Editor contains a FREQUENCIES command which holds the instructions we just gave SPSS in the Frequencies dialog. However, we don’t see the frequency distribution and bar chart we asked for. This is because we still need to run the command we just created.

How to run SPSS syntax?

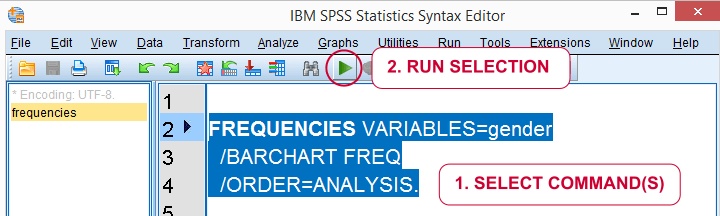
The simplest way to run syntax is to select the command(s) you’d like to run and click the “run selection” icon  in your toolbar.

A faster way to run syntax is to use several shortkeys, especially

  • F2 for selecting the command in which your mouse pointer is located;
  • Ctrl + a for selecting all syntax;
  • Ctrl + r for running all selected commands.

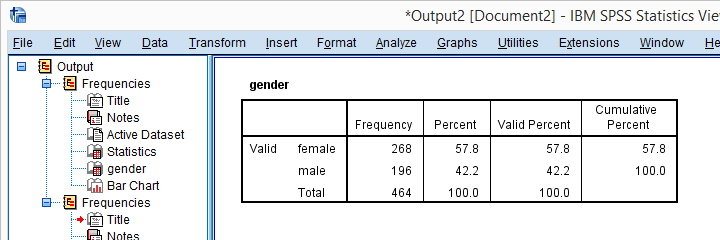
So let’s now run our pasted syntax. On doing so, a new window will open, containing our frequency table and barchart. This is an output window which we’ll discuss in our next tutorial.

How to get SPSS syntax?

The right way to do basically anything in SPSS -editing and analyzing data, creating tables and charts and more- is by running syntax. So how to get syntax? First off, using the Paste button from the menus adds syntax to your syntax window. If you don’t have a syntax window open yet, it’ll open one for you. Options for opening a syntax window are

  • using the Paste button from the menus;
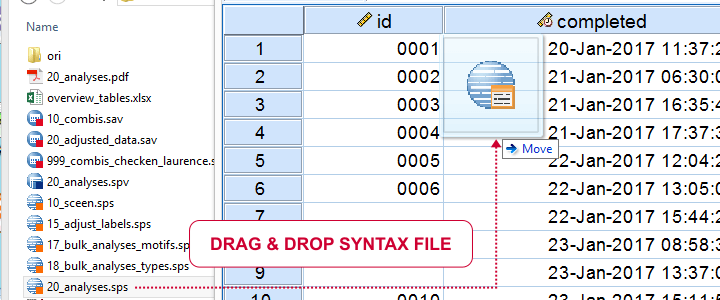
  • drag and drop a syntax file into the Data Editor window (shown below);
  • clicking the New Syntax  toolbar icon;
  • Navigate to File > New > Syntax.

If you’ve a syntax window open, you still need the actual syntax. Options to get the syntax you need are

  • use the Paste button from SPSS’ menu;
  • copy-paste syntax from our tutorials, online forums and elsewhere;
  • type the commands you need into the syntax window.

Now, typing syntax may seem like a crazy thing to do at this point. However,typing syntax is much easier than it seems because most of it can be dramatically simplified.

The syntax we just pasted from the menu was:

FREQUENCIES VARIABLES=gender
/BARCHART FREQ
/ORDER=ANALYSIS.

Now typing all that manually is a lot of work. However, we’ll get the exact same results if we run:

frequencies gender
/barchart.

Just typing and running this is much faster and easier than clicking through all menu options. So if you want to get real good -and real fast– with SPSS, start learning short syntax. This will take some practice but it will save you tons of time and effort in the longer run.

SPSS Syntax Files

We can now save all contents of our Syntax Editor as a syntax file by going to File > Save as… The resulting syntax file has the .sps (for “SPSS syntax”) file extension and is a plain text file. You can open, edit and save it with SPSS or any text editor such as Notepad++.

When saving syntax in newer SPSS versions, something like* Encoding: UTF-8.may be added. Just leave and ignore this, it’s not meant for you but, rather, some kind of “note to self” from SPSS.

Why even use SPSS syntax?

The single best SPSS practice is doing everything from syntax. Some reasons for this are

  • you’ll always know exactly which steps you took in which order so you can prove that your results are correct;
  • if you made some mistake -don’t we all sometimes?- you can correct it and rerun everything you did in just seconds;
  • you’ll work way faster than from the menu and you never have to do things twice;
  • some of the best SPSS tricks and time savers are available as syntax only.

So say you run 10 tables and charts from the menu. And then you realize you should have filtered out all respondents working in IT. Now you have to start all over again: remove the unwanted respondents and click your way through all the same menus and dialogs again…Sounds like a terrible idea. Doesn’t it?Unfortunately, I see students having to do days of SPSS work all over again on a daily basis. Not working from syntax really is the very worst SPSS practice.

So say I run those 10 tables and charts and I saved all syntax. Then I realize I should have filtered out all respondents working in IT. Ok. No problem. I’ll just addSELECT IF (jtype <> 3).to the top of my syntax and rerun all tables and charts in one go.

Thanks for reading!

The post SPSS Syntax Editor Window – Quick Overview of User Interface appeared first on HKT Consultant.

]]>
https://phantran.net/spss-syntax-editor-window-quick-overview-of-user-interface.htm/feed 0
SPSS Keyboard Shortcuts https://phantran.net/spss-keyboard-shortcuts.htm https://phantran.net/spss-keyboard-shortcuts.htm#respond Wed, 14 Sep 2022 07:16:50 +0000 https://phantran.net/?p=43913 SPSS keyboard shortcuts allow you to work with amazing speed. Some of the best SPSS shortkeys are not obvious at all so we’ll list our 20 favorite SPSS shortkeys in the table below. WHERE SHORTKEY USEFUL FOR Data Editor CTRL + t Switch between data view and variable view. Data Editor CTRL + up / down Go to

The post SPSS Keyboard Shortcuts appeared first on HKT Consultant.

]]>
SPSS keyboard shortcuts allow you to work with amazing speed. Some of the best SPSS shortkeys are not obvious at all so we’ll list our 20 favorite SPSS shortkeys in the table below.

WHERE SHORTKEY USEFUL FOR
Data Editor CTRL + t Switch between data view and variable view.
Data Editor CTRL + up / down Go to first/last variable/case (depending on view). Allows for very quick case and variable count when combined with CTRL + t.
Syntax Window Shift + up / down Select lines of syntax above/below cursor position.
Syntax Window F2 Select Entire Command in which cursor is located.
Syntax Window CTRL + r Run selected syntax.
Any Window CTRL + Home / End Go to beginning/end of window contents.
Syntax Window CTRL + c Copy selected syntax.
Syntax Window CTRL + x Cut selected syntax.
Syntax Window CTRL + v Paste selected syntax.
Syntax Window CTRL + a Select all syntax in window.
Syntax Window CTRL + f Find expression within syntax window.
Syntax Window CTRL + h Replace expression within syntax window.
Syntax Window CTRL + z Undo last edit(s). Note: doesn’t always seem to work properly in recent SPSS versions.
Syntax Window Home / End Move to start/end of line.
Any Window Alt + tab Switch between Syntax Window, Data Editor and Viewer Windows. Actually an MS Windows shortkey for switching between applications.
Any Window Alt + F4 Close any window. You’ll usually get a pop-up window asking whether you’d like to save it if you haven’t done so yet.
Syntax Window F1 When your cursor is located anywhere in a command, help for this command can be opened by pressing F1.
Syntax Window Shift + Home / End Select from cursor through start/end of line.
Any Window CTRL + Shift + Home / End Select from cursor through beginning/end of window contents.
Syntax Window CTRL + y Redo last edit(s).
Any Window Alt + F6 Back to previous window. Handy for switching between Syntax Window and Data Editor.
 

The post SPSS Keyboard Shortcuts appeared first on HKT Consultant.

]]>
https://phantran.net/spss-keyboard-shortcuts.htm/feed 0
Preparation before using SPSS: Research Problems and Variables https://phantran.net/preparation-before-using-spss-research-problems-and-variables.htm https://phantran.net/preparation-before-using-spss-research-problems-and-variables.htm#respond Wed, 14 Sep 2022 08:43:56 +0000 https://phantran.net/?p=41755 1. Research Problems The research process begins with an issue or problem of interest to the researcher. This research problem is a statement that asks about the relationships between two or more variables.1 Almost all research studies have more than two variables. Appendix B provides templates to help you phrase your research problem, and provides

The post Preparation before using SPSS: Research Problems and Variables appeared first on HKT Consultant.

]]>
1. Research Problems

The research process begins with an issue or problem of interest to the researcher. This research problem is a statement that asks about the relationships between two or more variables.1 Almost all research studies have more than two variables. Appendix B provides templates to help you phrase your research problem, and provides examples from the expanded high school and beyond (HSB) data set that is described in this chapter and used throughout the book.

The process of moving from a sense of curiosity, or a feeling that there is an unresolved problem to a clearly defined, researchable problem, can be a complex and long one. That part of the research process is beyond the scope of this book, but it is discussed in most books about research methods and books about completing a dissertation or thesis.

2. Variables

Key elements in a research problem are the variables. A variable is defined as a characteristic of the participants or situation in a given study that has different values. A variable must vary or have different values in the study. For example, gender can be a variable because it has two values, female or male. Age is a variable that can have a large number of values. Type of treatment/intervention (or type of curriculum) is a variable if there is more than one treatment or a treatment and a control group. The number of days to learn something or to recover from an ailment are common measures of the effect of a treatment and, thus, are also potential variables. Similarly, amount of mathematics knowledge can be a variable because it can vary from none to a lot.

However, even if a characteristic has the potential to be a variable, if it has only one value in a particular study, it is not a variable; it is a constant. Thus, ethnic group is not a variable if all participants in the study are European American. Gender is not a variable if all participants in a study are female.

In quantitative research, variables are defined operationally and are commonly divided into independent variables (active or attribute), dependent variables, and extraneous variables. Each of these topics is dealt with briefly in the following sections.

Operational Definitions of Variables

An operational definition describes or defines a variable in terms of the operations or techniques used to make it happen or measure it. When quantitative researchers describe the variables in their study, they specify what they mean by demonstrating how they measured the variable. [1] Demographic variables like age, gender, or ethnic group are usually measured simply by asking the participant to choose the appropriate category from a list.

Types of treatment (or curriculum) are usually operationally defined much more extensively by describing what was done during the treatment or new curriculum. Likewise, abstract concepts like mathematics knowledge, self-concept, or mathematics anxiety need to be defined operationally by spelling out in some detail how they were measured in a particular study. To do this, the investigator may provide sample questions, append the actual instrument, or provide a reference where more information can be found.

Independent Variables

There are two types of independent variables, active and attribute. It is important to distinguish between these types when we discuss the results of a study. As presented in more detail later, an active independent variable is a necessary but not sufficient condition to make cause and effect conclusions.

Active or manipulated independent variables. An active independent variable is a variable, such as a workshop, new curriculum, or other intervention, at least one level of which is given to a group of participants, within a specified period of time during the study.

For example, a researcher might investigate a new kind of therapy compared to the traditional treatment. A second example might be to study the effect of a new teaching method, such as cooperative learning, compared to independent learning. In these two examples, the variable of interest is something that is given to the participants. Thus, active independent variables are given to the participants in the study but are not necessarily given or manipulated by the experimenter. They may be given by a clinic, school, or someone other than the investigator, but from the participants’ point of view, the situation is manipulated. To be considered an active independent variable, the treatment should be given after the study is planned so that there could be a pretest. Other writers have similar but, perhaps, slightly different definitions of active independent variables. Randomized experimental and quasi-experimental studies have an active independent variable.

Attribute or measured independent variables. An independent variable that cannot be manipulated, yet is a major focus of the study, can be called an attribute independent variable. In other words, the values of the independent variable are preexisting attributes of the persons or their ongoing environment that are not systematically changed during the study. For example, level of parental education, socioeconomic status, gender, age, ethnic group, IQ, and self-esteem are attribute variables that could be used as attribute independent variables. Studies with only attribute independent variables are called nonexperimental studies.

Unlike authors of some research methods books, we do not restrict the term independent variable to those variables that are manipulated or active. We define an independent variable more broadly to include any predictors, antecedents, or presumed causes or influences under investigation in the study. Attributes of the participants as well as active independent variables fit within this definition. For the social sciences and education, attribute independent variables are especially important. Type of disability or level of disability may be the major focus of a study. Disability certainly qualifies as a variable because it can take on different values even though they are not given during the study. For example, cerebral palsy is different from Down syndrome, which is different from spina bifida, yet all are disabilities. Also, there are different levels of the same disability. People already have defining characteristics or attributes that place them into one of two or more categories. The different disabilities are characteristics of the participants before we begin our study. Thus, we might also be interested in studying how variables that are not given or manipulated during the study, even by other persons, schools, or clinics, predict various other variables that are of interest.

Other labels for the independent variable. SPSS uses a variety of terms, such as factor (Chapter 10) and grouping variable (Chapter 9), for the independent variables. In other cases, (Chapters 7 and 8) the program and statisticians do not make a distinction between the independent and dependent variable; they just label them variables. For example, technically there is no independent variable for a correlation or chi-square. Even for chi-square and correlation, we think it is sometimes conceptually useful to think of one variable as the predictor (independent variable) and the other as the outcome (dependent variable); however, it is important to realize that the statistical tests of correlation and chi-square treat both variables in the same way, rather than treating one as a predictor and one as an outcome variable, as is the case in regression.

Type of independent variable and inferences about cause and effect. When we analyze data from a research study, the statistical analysis does not differentiate whether the independent variable is an active independent variable or an attribute independent variable. However, even though most statistics books use the label independent variable for both active and attribute variables, there is a crucial difference in interpretation.

A major goal of scientific research is to be able to identify a causal relationship between two variables. For those in applied disciplines, the need to demonstrate that a given intervention or treatment causes a change in behavior or performance can be extremely important. Only the approaches that have an active independent variable (randomized experimental and, to a lesser extent, quasi-experimental) can provide data that allow one to infer that the independent variable caused the change or difference in the dependent variable.

In contrast, a significant difference between or among persons with different values of an attribute independent variable should not lead one to conclude that the attribute independent variable caused the dependent variable to change. Thus, this distinction between active and attribute independent variables is important because terms such as main effect and effect size used by the program and most statistics books might lead one to believe that if you find a significant difference, the independent variable caused the difference. These terms can be misleading when the independent variable is an attribute.

Although nonexperimental studies (those with attribute independent variables) are limited in what can be said about causation, they can lead to solid conclusions about the differences between groups and about associations between variables. Furthermore, if the focus of your research is on attribute independent variables, a nonexperimental study is the only available approach. For example, if you are interested in learning how boys and girls learn mathematical concepts, you are interested in the attribute independent variable of gender.

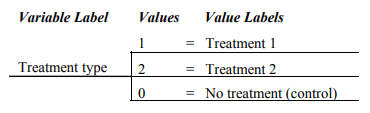
Values of the independent variable. SPSS uses the term values to describe the several options or categories of a variable. These values are not necessarily ordered, and several other terms, categories, levels, groups, or samples, are sometimes used interchangeably with the term values, especially in statistics books. Suppose that an investigator is performing a study to investigate the effect of a treatment. One group of participants is assigned to the treatment group. A second group does not receive the treatment. The study could be conceptualized as having one independent variable (treatment type), with two values or levels (treatment and no treatment). The independent variable in this example would be classified as an active independent variable. Now, suppose instead that the investigator was interested primarily in comparing two different treatments but decided to include a third no-treatment group as a control group in the study. The study would still be conceptualized as having one active independent variable (treatment type), but with three values or levels (the two treatment conditions and the control condition). This variable could be diagrammed as follows:
As an additional example, consider gender, which is an attribute independent variable with two values, male and female. It could be diagrammed as follows:
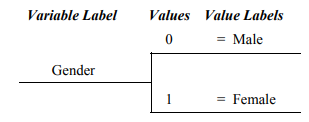
Note that in this program each variable is given a variable label; moreover, the values, which are often categories, have value labels (e.g., male and female). Each value or level is assigned a number used to compute statistics. It is especially important to know the value labels when the variable is nominal, that is, when the values of the variable are just names and thus are not ordered.

Dependent Variables

The dependent variable is assumed to measure or assess the effect of the independent variable. It is thought of as the presumed outcome or criterion. Dependent variables are often test scores, ratings on questionnaires, readings from instruments (e.g., electrocardiogram, galvanic skin response, etc.), or measures of physical performance. When we discuss measurement in Chapters 2 and 3, we are usually referring to the dependent variable. Dependent variables, like independent variables, must have at least two values; most of the dependent variables used in this book have many values, varying from low to high so they are not as easy to diagram as the independent variables shown earlier.

SPSS also uses a number of other terms for the dependent variable. Dependent list is used in cases where you can do the same statistic several times for a list of dependent variables (e.g., in Chapter 10 with one-way ANOVA). The term test variable is used in Chapter 9 for the dependent variable in a t test.

Extraneous Variables

These are variables (also called nuisance variables or, in some designs, covariates) that are not of interest in a particular study but could influence the dependent variable. Environmental factors (e.g., temperature or distractions), time of day, and characteristics of the experimenter, teacher, or therapist are some possible extraneous variables that need to be controlled. SPSS does not use the term extraneous variable. However, sometimes such variables are “controlled” using statistics that are available in this program.

[1] To help you, we have identified the variable names, labels, and values using italics (e.g., gender and male) and have put in bold the terms used in the windows and outputs (e.g., Data Editor), and we use bold for other key terms when they are introduced, defined, or are important to understanding. Underlines are used to focus your attention on critical points or phrases that could be missed. Italics are also used, as is commonly the case, for emphasizing words and for the titles of books.

Source: Morgan George A, Leech Nancy L., Gloeckner Gene W., Barrett Karen C.

(2012), IBM SPSS for Introductory Statistics: Use and Interpretation, Routledge; 5th edition; download Datasets and Materials.

The post Preparation before using SPSS: Research Problems and Variables appeared first on HKT Consultant.

]]>

https://phantran.net/preparation-before-using-spss-research-problems-and-variables.htm/feed 0
Preparation before using SPSS: Research Hypotheses and Questions https://phantran.net/preparation-before-using-spss-research-hypotheses-and-questions.htm https://phantran.net/preparation-before-using-spss-research-hypotheses-and-questions.htm#respond Wed, 14 Sep 2022 08:57:05 +0000 https://phantran.net/?p=41756 Research hypotheses are predictive statements about the relationship between variables. Research questions are similar to hypotheses, except that they do not entail specific predictions and are phrased in question format. For example, one might have the following research question: “Is there a difference in students’ scores on a standardized test if they took two tests

The post Preparation before using SPSS: Research Hypotheses and Questions appeared first on HKT Consultant.

]]>
Research hypotheses are predictive statements about the relationship between variables. Research questions are similar to hypotheses, except that they do not entail specific predictions and are phrased in question format. For example, one might have the following research question: “Is there a difference in students’ scores on a standardized test if they took two tests in one day versus taking only one test on each of two days?” A hypothesis regarding the same issue might be: “Students who take only one test per day will score higher on standardized tests than will students who take two tests in one day.”

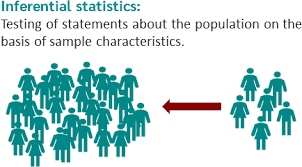
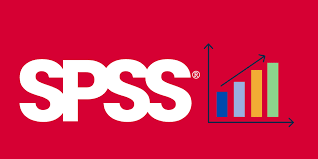
We divide research questions into three broad types: difference, associational, and descriptive, as shown in the middle of Fig. 1.1. The figure also shows the general and specific purposes and the general types of statistics for each of these three types of research question. We think it is educationally useful to divide inferential statistics into two types corresponding to difference and associational hypotheses or questions.[1] Difference inferential statistics (e.g., t test or analysis of variance) are used for approaches that test for differences between groups. Associational inferential statistics test for associations or relationships between variables and use, for example, correlation or multiple regression analysis. We utilize this contrast between difference and associational inferential statistics in Chapter 6 and later in this book.

Difference research questions. For these questions, we compare scores (on the dependent variable) of two or more different groups, each of which is composed of individuals with one of the values or levels on the independent variable. This type of question attempts to demonstrate that the groups are not the same on the dependent variable.

Associational research questions. Here we associate or relate two or more variables. This approach usually involves an attempt to see how two or more variables covary (e.g., if a person has higher values on one variable, he or she is also likely to have higher, or lower, values on another variable) or how one or more variables enable one to predict another variable.

Descriptive research questions. These are not answered with inferential statistics. They merely describe or summarize data for the sample actually studied, without trying to generalize to a larger population of individuals.

Fig. 1.1. Schematic diagram showing how the purpose and type of research question correspond to the general type of statistic used in a study.

Fig. 1.1 shows that both difference and associational questions or hypotheses explore the relationships between variables; however, they are conceptualized differently, as will be described shortly.[2] Note that difference and associational questions differ in specific purpose and the kinds of statistics they use to answer the question.

Table 1.1 provides the general format and one example of a basic difference question, a basic associational question, and a basic descriptive question. Remember that research questions are similar to hypotheses, but they are stated in question format. We think it is advisable to use the question format for the descriptive approach or when one does not have a clear directional prediction. More details and examples are given in Appendix B. As implied by Fig. 1.1, it is acceptable to phrase any research question that involves two variables as whether or not there is a relationship between the variables (e.g., is there a relationship between gender and math achievement or is there a relationship between anxiety and GPA?). However, we think that phrasing the question as a difference or association is preferable because it helps one identify an appropriate statistic and interpret the result.

Complex Research Questions

Some research questions involve more than two variables at a time. We call such questions and the appropriate statistics complex. Some of these statistics are called multivariate in other texts, but there is not a consistent definition of multivariate in the literature. We provide examples of how to write certain complex research questions in Appendix B, and in Chapters 8 and 10, we introduce two complex statistics: multiple regression and factorial ANOVA. Complex statistics are discussed in more detail in our companion volume, Leech et al. (in press).

Table 1.1. Examples of Three Kinds of Basic Research Questions/Hypotheses

  1. Basic Difference (group comparison) Questions
  • Usually used for randomized experimental, quasi-experimental, and comparative approaches.
  • For this type of question, the groups of individuals who share a level of an active independent variable (e.g., intervention group) or an attribute independent variable (e.g., male gender) are compared to individuals who share the other levels of that same independent variable (e.g., control group or female gender) to see if the groups differ with regard to the average scores on the dependent variable (e.g., aggression scores).
  • Example: Do persons who experienced an emotion regulation intervention differ from those who did not experience that intervention with respect to their average aggression scores? In other words, will the average aggression score of the intervention group be significantly different from the average aggression score for the control group following the intervention?
  1. Basic Associational (relational) Questions
  • Used for the associational approach, in which the independent variable usually is continuous (i.e., has many ordered levels).
  • For this type of question, the scores on the independent variable (e.g., anxiety) are associated with or related to the dependent variable scores (e.g., GPA).
  • Example: Will students’ degree of anxiety be associated with their overall GPA? In other words, will knowing students’ level of anxiety tell us anything about their tendency to make higher versus lower grades? If there is a negative association (correlation) between anxiety scores and grade point average, those persons who have high levels of anxiety will tend to have low GPAs, those with low anxiety will tend to have high GPAs, and those in the middle on anxiety will tend to be in the middle on GPA.
  1. Basic Descriptive Questions
  • Used for the descriptive approach.
  • For this type of question, scores on a single variable are described in terms of their central tendency, variability, or percentages in each category/level.
  • Example: What percentage of students make a B or above? What is the average level of anxiety found in 9th grade students? The average GPA was 2.73, or 30% had high anxiety.

[1] We realize that all parametric inferential statistics are relational so this dichotomy of using one type of data analysis procedure to test for differences (when there are a few values or levels of the independent variables) and another type of data analysis procedure to test for associations (when there are continuous independent variables) is somewhat artificial. Both continuous and categorical independent variables can be used in a general linear model approach to data analysis. However, we think that the distinction is useful because most researchers utilize the dichotomy in selecting statistics for data analysis.

[2]This similarity is in agreement with the statement by statisticians that all common parametric inferential statistics are relational. We use the term associational for the second type of research question rather than relational or correlational to distinguish it from the general purpose of both difference and associational questions/hypotheses, which is to study relationships. Also we want to distinguish between correlation, as a specific statistical technique, and the broader type of associational question and that group of statistics.

Source: Morgan George A, Leech Nancy L., Gloeckner Gene W., Barrett Karen C.

(2012), IBM SPSS for Introductory Statistics: Use and Interpretation, Routledge; 5th edition; download Datasets and Materials.

The post Preparation before using SPSS: Research Hypotheses and Questions appeared first on HKT Consultant.

]]>
https://phantran.net/preparation-before-using-spss-research-hypotheses-and-questions.htm/feed 0
Opening and saving SPSS datasets https://phantran.net/opening-and-saving-spss-datasets.htm https://phantran.net/opening-and-saving-spss-datasets.htm#respond Wed, 14 Sep 2022 08:58:08 +0000 https://phantran.net/?p=43920 This post outlines all the possible ways to open and save datasets in SPSS, that works similarly to those tasks in other computer applications. There are a few differences. Let’s have a quick look at how we can do it in SPSS. In practice, a SPSS dataset can be opened in a variety of ways,

The post Opening and saving SPSS datasets appeared first on HKT Consultant.

]]>
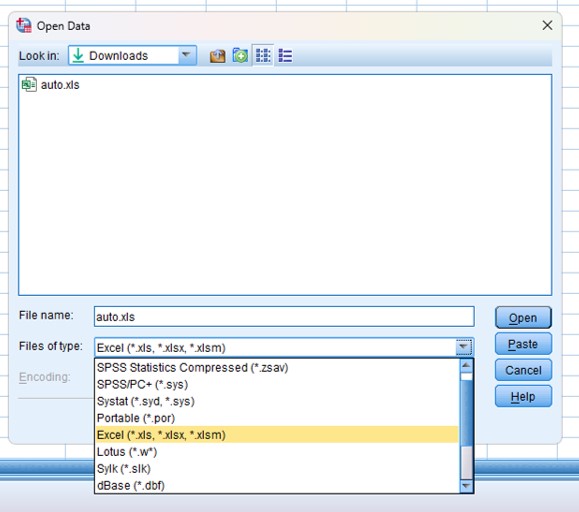
This post outlines all the possible ways to open and save datasets in SPSS, that works similarly to those tasks in other computer applications. There are a few differences. Let’s have a quick look at how we can do it in SPSS. In practice, a SPSS dataset can be opened in a variety of ways, most of which are probably familiar to you from other applications, however. First, it is possible to save and open files from within SPSS’s menu. Second, SPSS allows multiple datasets to be active at any one time in different data editor windows. That means we can use multiple datasets at once (download datasets).

For opening a Stata dataset, in the easiest way, just Double-click on a SPSS data file, which is a file whose extension is .sav. Note that The file extension may not be visible, depending on what options you have set in your operating system.

Also, you can firstly open SPSS, then select File > Open, or click on the Open button and navigate to the file you want.

In another way, you can open datasets recently used by selecting File > Recently used Data, and click on the dataset you want.

SPSS allows multiple datasets to be active at any one time in different data editor windows. That means we can use multiple datasets at once.

For saving a Stata dataset, there are 2 situations of saving a dataset, that has been changed; and saving an unnamed dataset or an old dataset under a new name. We can do it as following:

To save a dataset that has been changed, select File > Save; or just click on the Save button on SPSS menu. Note: once you overwrite a dataset, there is no way to recover your original dataset. With important datasets, you may want to either keep a backup copy of your original filename dataset, or save your changes to a dataset under a new name. This is no different from working with a word-processing document, except that recovering from an inadvertent save of a dataset is nearly impossible.

To save an unnamed dataset, or an old dataset under a new name: just select File > Save as….

Note: that Changes you have made to a dataset are not permanent until you save them. You work with a copy of the dataset in memory, not with the data file itself. This should not be surprising, because it is the way that you work with almost all applications on your computer.

The post Opening and saving SPSS datasets appeared first on HKT Consultant.

]]>

https://phantran.net/opening-and-saving-spss-datasets.htm/feed 0