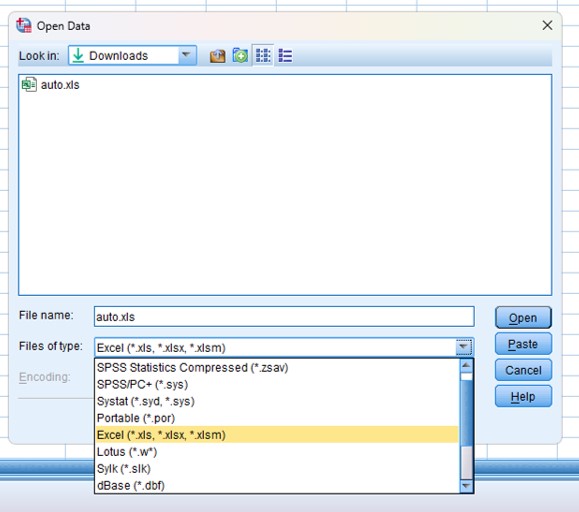
SPSS means “Statistical Package for the Social Sciences” and was first launched in 1968. Since SPSS was acquired by IBM in 2009, it’s officially known as IBM SPSS Statistics but most users still just refer to it as “SPSS”. SPSS is software for editing and analyzing all sorts of data. These data may come from basically any source: scientific research, a customer database, Google Analytics or even the server log files of a website. SPSS can open all file formats that are commonly used for structured data such as: spreadsheets from MS Excel or OpenOffice; plain text files (.txt or .csv); relational (SQL) databases; Stata and SAS.
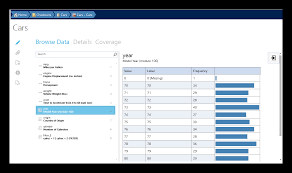
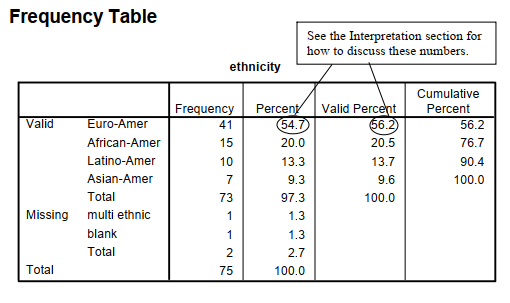
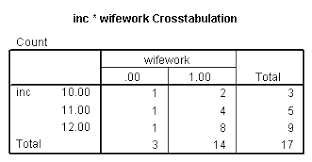
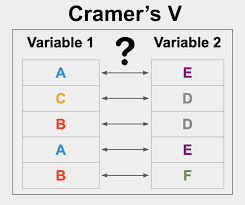
- Statistics Program: SPSS’s statistics program gives a large amount of basic statistical functionality; some include frequencies, cross-tabulation, bivariate statistics, etc.
- Modeler Program: Researchers are able to build and validate predictive models with the help of advanced statistical procedures.
- Text Analytics for Surveys Program: It gives robust feedback analysis. which in turn get a vision for the actual plan.
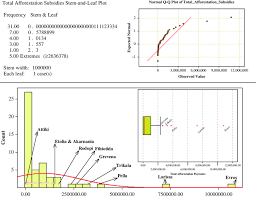
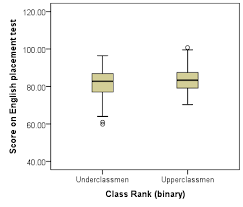
- Visualization Designer: Researchers found this visual designer data to create a wide variety of visuals like density charts and radial box plots.
Main contentsSee more from basic to advanced


Thanks for reading!
14 Sep 2022
15 Sep 2022
30 Mar 2023
16 Sep 2022
29 Mar 2023
14 Sep 2022