In SPSS, we usually work from 3 windows. These are: the data editor window, the output viewer window and the syntax editor window. The second main window is the output viewer window. Right, let’s now download and open bank.sav. We’ll use it for walking you through the main parts of the output viewer.
Right. So with our data open, let’s create some output by running the syntax below; or see the video to running the descriptive analysis.
frequencies educ marit jtype
/barchart
/order variable.
Running this opens an output viewer window as shown below.
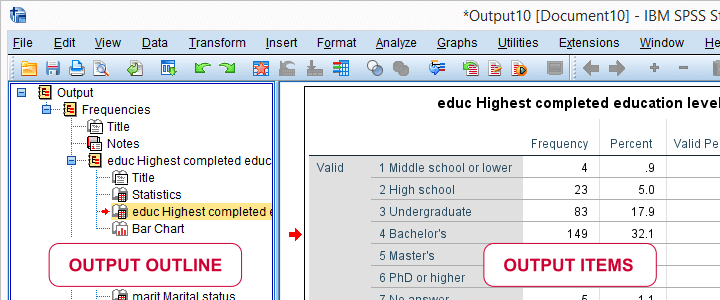
As illustrated, the SPSS output viewer window always has 2 main panes:
- the output outline is mostly used for navigating through your output items and
- the actual output items -mostly tables and charts- are often exported to WORD or Excel for reporting.
In the output outline, you can also delete output items -SPSS often produces way more output than you ask for. Use the ctrl key to select multiple items. A faster way for deleting a selection of output items is OUTPUT MODIFY.
You can also collapse and reorder output items in the outline but I don’t find that too useful. So let’s turn to the actual output items. The most important ones are tables and charts so we’ll discuss those separately.
SPSS Output – Tables
We’ll usually want to make some adjustments to our output tables. One option for doing so is right-clicking the table and selecting > as shown below.
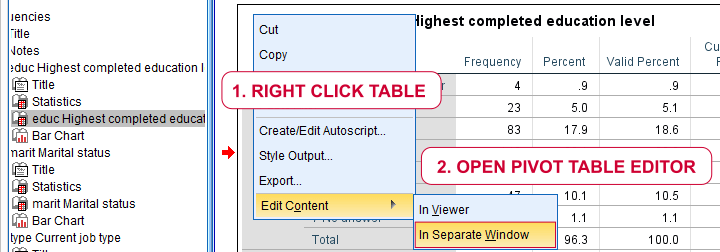
The pivot table editor window (shown below) allows us to adjust basically anything about our table.
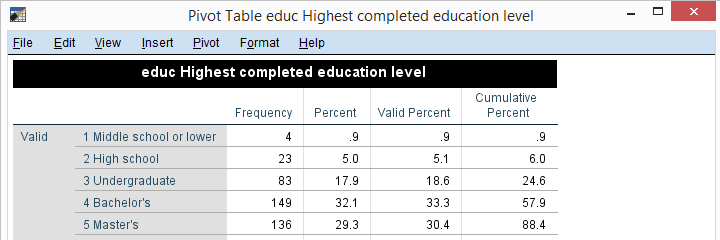
That being said, we recommend youonly use the pivot table editor if everything else fails. One reason is that you can’t replicate and rerun whatever you do in the pivot table editor.
Variable and Value Labels in Output Tables
When I’m inspecting my data, I want to see variable names and labels in my output. The same goes for values and value labels because I want to know how my variables have been coded.
However, I want to see only labels in the final tables that I’ll report. One way for doing so is navigating to > and selecting the tab.
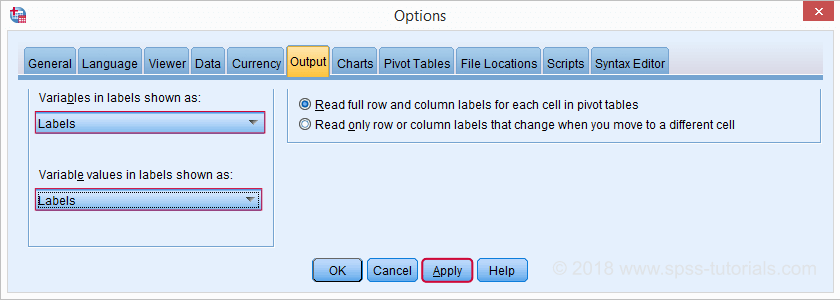
Oddly, the options dialog has no button. This is because it creates very messy syntax. A much better option for this than the crappy menu is just running the syntax below.
set
tnumbers labels
tvars labels.
- TVARS is short for ”table variables”. It sets how variables are shown in tables: names, labels or both;
- TNUMBERS is short for “table numbers”. It sets how values are shown in tables: values, labels or both.
Running this syntax is a much better option than using the aforementioned menu. After doing so, all output tables we’ll run will show only variable and value labels.
SPSS Output – Charts
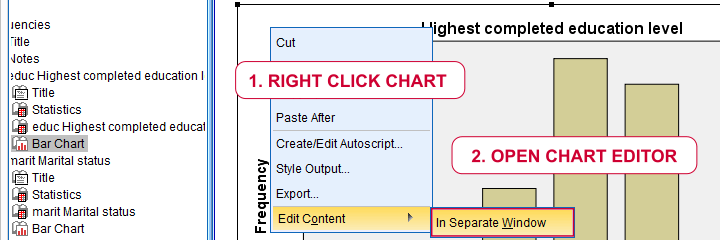
First off, you can adjust basically anything about charts in the chart editor window. You can open one by right clicking a chart as shown below.
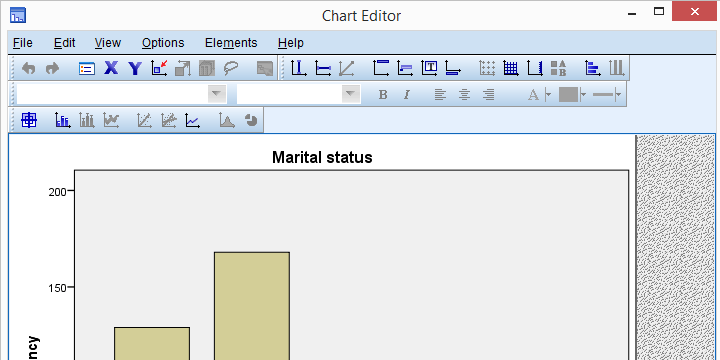
This opens a chart editor window as shown below.
Right, so that’ll do for introducing SPSS output. I hope we clarified some basics.
30 Mar 2023
20 Sep 2022
15 Sep 2022
16 Sep 2022
30 Mar 2023
15 Sep 2022