In SPSS, we usually work from 3 windows. These are: the data editor window, the output viewer window and the syntax editor window. The first main window is the data editor. This is the only window that’s always open when we run SPSS.
Right, let’s now download and open bank.sav. We’ll use it for walking you through the main parts of the data editor.
SPSS Data View & Variable View
An SPSS data file always has two tabs in the left bottom corner:
- Data View is where we inspect our actual data and
- Variable View is where we see additional information about our data.
You can switch between Data View and Variable View by
- clicking the tabs in the left bottom corner;
- using the Ctrl + t shortkey;
- double-clicking a variable name in Data View;
- double-clicking an outline number in Variable View.
Let’s first take a close look at the main parts of the Data View tab. We’ll then proceed with variable view.
SPSS Data View
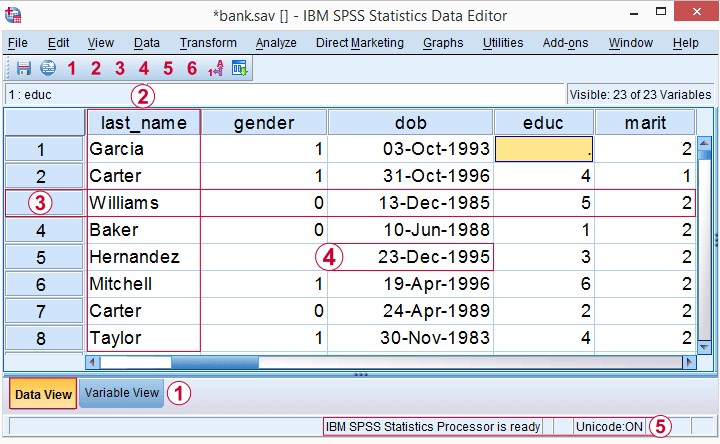
1. The data editor has tabs for switching between Data View and Variable View. For now, make sure you’re in Data View.
2. Columns of cells are called variables. Each variable has a unique name (“gender”) which is shown in the column header.
3. Rows of cells are called cases. Oftentimes, each respondent in a study is represented as a single case.
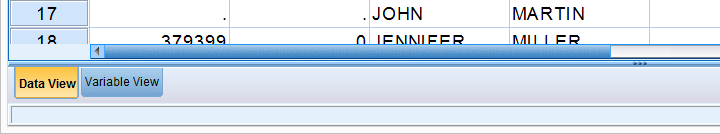
4. In SPSS, values refer to cell contents.
5. The status bar may give useful information on the data, for instance whether a WEIGHT, FILTER, SPLIT FILE or Unicode mode is in effect.
These are the main elements in Data View. Let’s now switch to Variable View.
SPSS Variable View
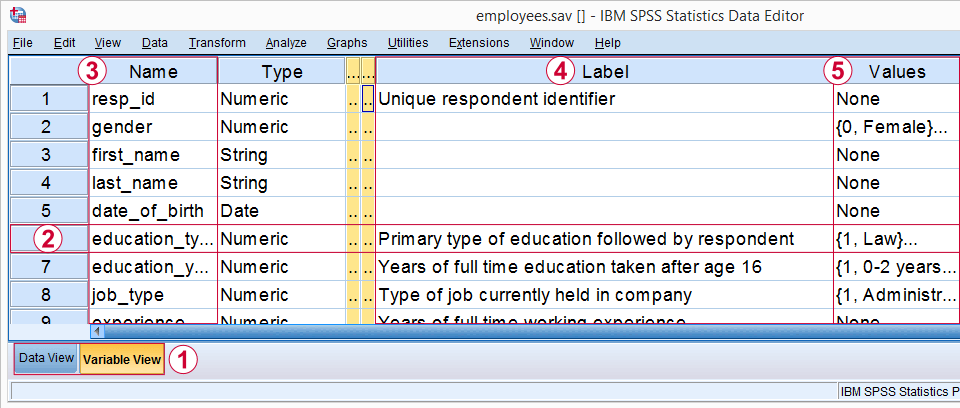
1. In the left bottom corner we find tabs for switching between Variable View and Data View. For now, select Variable View.
2. In Variable View, variables are shown as rows of cells.
3. The first column shows the variable name for each variable.
4. The fifth column may or may not contain a variable label. This describes the exact meaning of each variable.
5. The sixth column shows value labels: descriptions of the meaning of one, many or all values that a variable may contain.
In short, Variable View does not show the data itself but, rather, information about the data. This is sometimes called “metadata” or “the codebook”. In SPSS, however, it’s called the dictionary.
This is important to know because you may find commands like DISPLAY DICTIONARY or APPLY DICTIONARY in manuals. If you’re familiar with syntax, runningDISPLAY DICTIONARY.creates the output shown below: dictionary information as seen in variable view.
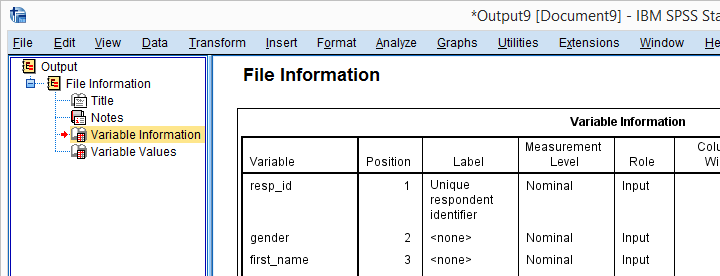
Dictionary information reported by running DISPLAY DICTIONARY.
Variable View – Value Labels
For some variables, it’s immediately clear what their values mean: a value of € 2500,- in a variable “gross monthly income” represents a gross monthly income of € 2500,-.
This is not always the case, however: answer categories for categorical variables are often represented by numbers -usually 1 through x. What these values represent is then stored in their value labels. Clicking the open value labels icon ![]() for education_type displays all value labels for this variable.
for education_type displays all value labels for this variable.
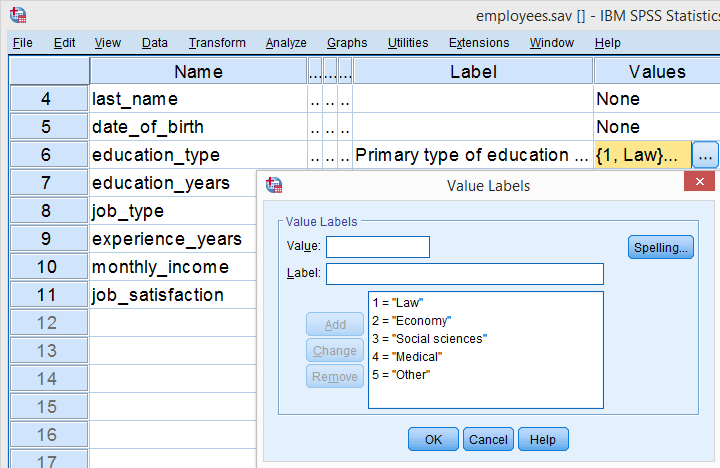
Value labels for education_type.
These value labels tell us that a person with a value of 1 on education_type indicates somebody who studied “Law”. In a similar vein, “Economy” is represented by a value of 2, and so on.
Dictionary Information in Data View
Thus far, we explained that SPSS’ Data Editor always has 2 tabs:
- Data View in which we inspect our actual data values and
- Variable View in which we find information about our data –dictionary information.
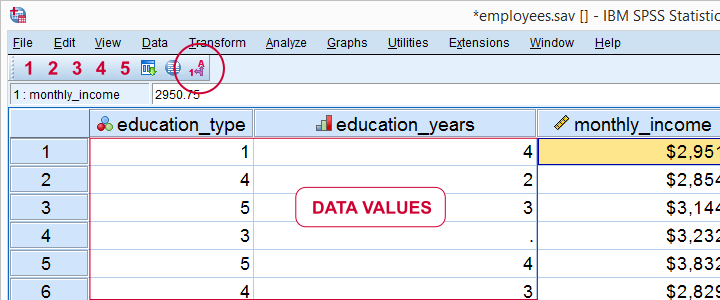
Little known by many SPSS users is that we can see some dictionary information in Data View too. Let’s start off with value labels. Initially, we just see data values in Data View as shown below.
Now, if we click the value labels icon ![]() we’ll see value labels instead of data values in data view.
we’ll see value labels instead of data values in data view.
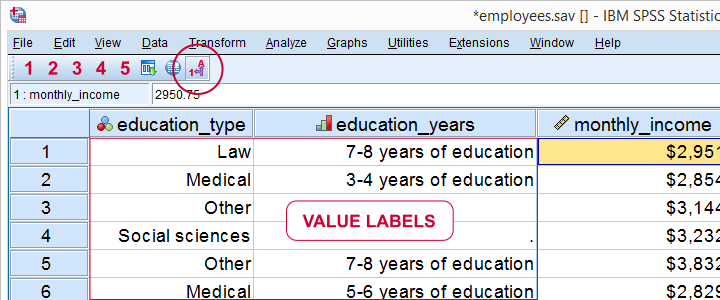
So this allows you to look up what your data mean without having to switch between Data View and Variable View. Perhaps even more useful: place your mouse pointer on a variable name in Data View without clicking it. Now a yellow box with a lot of dictionary information pops up for a few seconds.
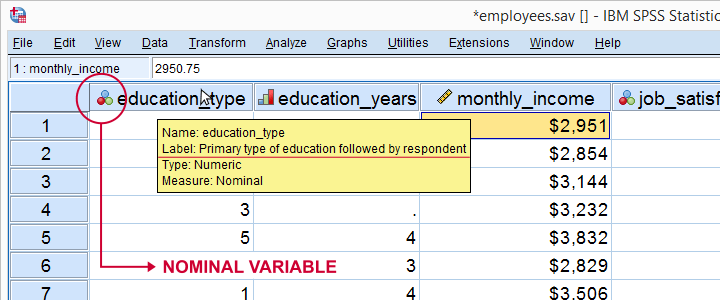
Starting from SPSS version 22, icons next to variable names tell us something about our variable types, formats and measurement levels -if correctly set, that is.
Perfectly written written content, Really enjoyed looking through.
I appreciate, cause I found exactly what I was looking for. You’ve ended my 4 day long hunt! God Bless you man. Have a nice day. Bye