Given the subject matter of this book, our focus thus far in this chapter has been on the stock market. However, we complete our discussion of sentiment by presenting a few major measures of sentiment in other markets.
1. Treasury Bond Futures Put/Call Ratio
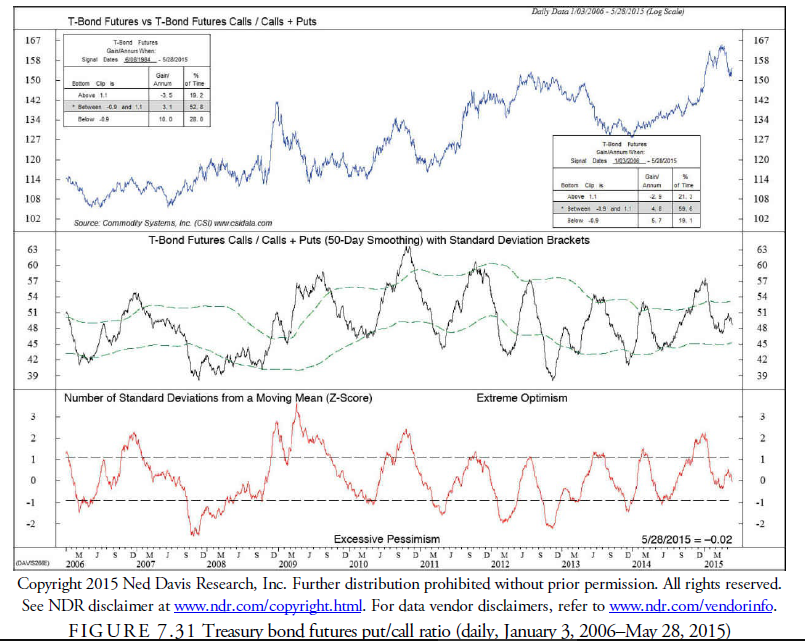
The advent of an options market in futures has created a whole world of new sentiment indicators for these futures markets. The most widely traded are the options of Treasury bond futures. Figure 7.31 shows the latest study by Ned Davis Research, Inc., of the predictive ability of these options using the standard put/call volume ratio as a proxy for speculation in the Treasury bond market. What they found was that when ratio advanced above 1.1, the market had too much optimism and that the subsequent decline per annum averaged -2.9%. On the other hand, when the ratio declined below 0.9, the market was too pessimistic and subsequently advanced 5.7% per annum. These figures are from the dates since January 3, 2006 and reflect the changes in the bond market after the Federal Reserve’s change in policy toward long-term bonds.
2. Treasury Bond COT Data
The spread between large speculators and commercial hedgers is positively correlated with bond prices and inversely related to long-term interest rates (see Figure 7.32). When testing the ratio of Commercial Longs to Shorts, Ned Davis Research, Inc., found that in the period between September 25, 1992 and May 22, 2015, when large speculators were net long, the bond market rose on average 5.4% per year and declined -5.3% per year when the ratio declined below 0.9.

3. Treasury Bond Primary Dealer Positions
Contradicting the preceding relationship between commercials and the future for the bond market is the relationship between primary dealer inventories and the future for bond prices. One would think that primary dealers in bonds, those who can deal with the Treasury Department directly, would have hedged inventory positions in long-term bonds and would thus be considered part of the commercial hedger designation by the CFTC in the COT reports. Further, this would suggest that the dealers would be net long at bond market bottoms and net short at tops. The opposite seems to be the case. Primary dealers have tended to have the most long positions at tops and the most short positions at bottoms (see Figure 7.33). The reason for this logical disparity is likely that dealers must anticipate customer demands. They buy issues from the auction and then sell them to customers. If customers have been bullish, dealers must have an inventory. Thus, they tend to be long at the top when they believe their customers are bullish and willing to pay extra for bonds. Likewise, when pessimism reigns, dealers are hesitant to build inventory and instead hold net short positions, believing that the pessimism will cause customers to sell to them. Thus, at bottoms, dealers become net short.
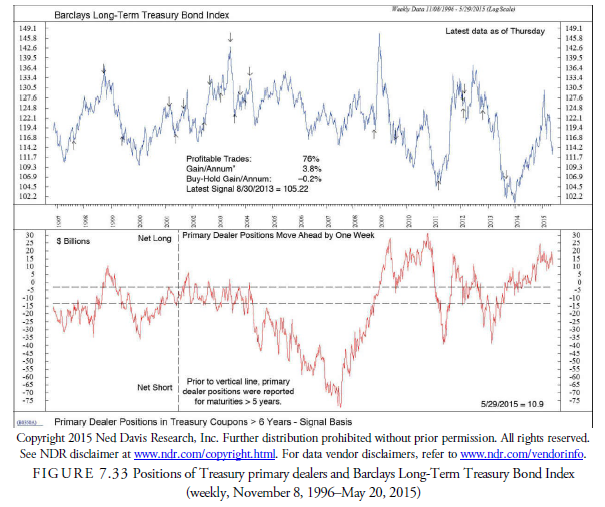
Ned Davis Research, Inc., found that by trading in the opposite direction from the dealers, a 3.8% annual gain versus a -0.2 loss with the buy-and-hold could be accomplished.
4. T-Bill Rate Expectations by Money Market Fund Managers
The money market fund business is highly competitive. Money managers, to compete on yield, tend to anticipate future short-term interest rates by lengthening or shortening the duration of their T-bill positions. Longer maturity positions suggest that money managers believe that short-term rates will decline, and shorter positions indicate a belief that short-term interest rates will rise. This has turned out to be a contrary indicator for the T-bill market yield. Money managers have tended to be generally incorrect in their assessment of the future for short-term rates. As seen in Figure 7.34, when money managers increase the maturity of their positions in anticipation of lower rates, the rates generally rise instead, and vice versa when they shorten their positions in anticipation of a rise in rates.
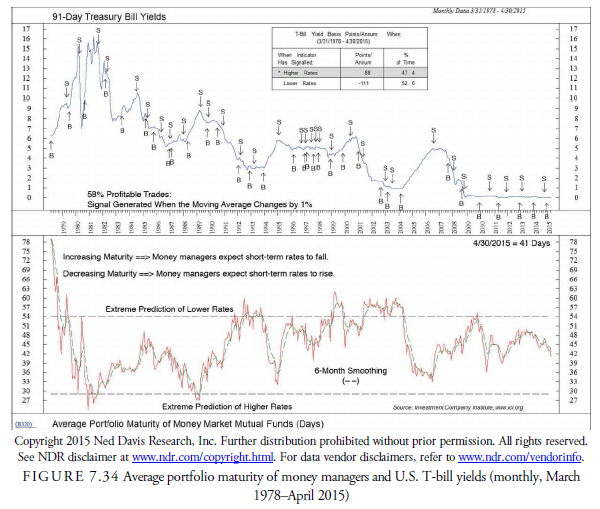
Figure 7.34 shows the results of a Ned Davis Research, Inc., study of money fund managers and found that when the average maturity in days rose above its six-month simple moving average, the 91-day Treasury bill rate advanced 102 basis points per annum. This measure then is a contrary indicator because when rates are expected to rise, managers should be shortening their maturity length to await the higher rates. Instead, when they believe the rates will go down, it appears they lengthen their maturity, and the T-bill market does just the opposite of their expectations. When the maturity length declines below its six-month simple moving average, the rate tends to advance, making this calculation a good contrary indicator of Treasury bill rates.
Source: Kirkpatrick II Charles D., Dahlquist Julie R. (2015), Technical Analysis: The Complete Resource for Financial Market Technicians, FT Press; 3rd edition.
Thanks for the marvelous posting! I definitely enjoyed reading it, you’re a great author.I will always bookmark your blog and definitely will come back in the future. I want to encourage that you continue your great posts, have a nice weekend!
Hi, i think that i saw you visited my site so i got here to “return the favor”.I am trying to find issues to improve my site!I guess its good enough to use some of your concepts!!