The Social Security system has been the subject of heated debate for some time now. Under the present system, a retired person receives an annual benefit that is initially determined at the time of retirement and is based on his or her work history. The benefit then increases from year to year at a rate equal to the rate of increase of the Consumer Price Index (CPI). Does the CPI accu- rately reflect the cost of living for retirees? Is it appropriate to use the CPI as we now do—as a cost-of-living index for other government programs, for private union pensions, and for private wage agreements? On a similar note, we might ask whether the Producer Price Index (PPI) accurately measures the change over time in the cost of production. The answers to these questions lie in the economic theory of consumer behavior. In this section, we describe the theoretical underpinnings of cost indexes such as the CPI, using an example that describes the hypothetical price changes that students and their parents might face.
1. Ideal Cost-of-Living Index
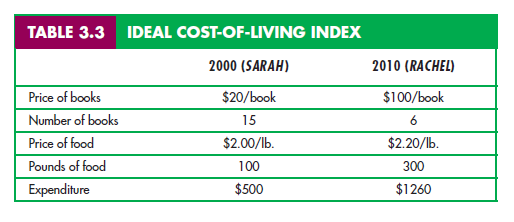
Let’s look at two sisters, Rachel and Sarah, whose preferences are identical. When Sarah began her college education in 2000, her parents gave her a “discretion- ary” budget of $500 per quarter. Sarah could spend the money on food, which was available at a price of $2.00 per pound, and on books, which were avail- able at a price of $20 each. Sarah bought 100 pounds of food (at a cost of $200) and 15 books (at a cost of $300). Ten years later, in 2010, when Rachel (who had worked during the interim) is about to start college, her parents promise her a budget that is equivalent in buying power to the budget given to her older sister. Unfortunately, prices in the college town have increased, with food now $2.20 per pound and books $100 each. By how much should the discretionary budget be increased to make Rachel as well off in 2010 as her sister Sarah was in 2000? Table 3.3 summarizes the relevant data and Figure 3.24 provides the answer.
The initial budget constraint facing Sarah in 2000 is given by line l1 in Figure 3.24; her utility-maximizing combination of food and books is at point A on indifference curve U1. We can check that the cost of achieving this level of utility is $500, as stated in the table:
$500 = 100 lbs. of food * $2.00/lb. + 15 books * $20/book
As Figure 3.24 shows, to achieve the same level of utility as Sarah while facing the new higher prices, Rachel requires a budget sufficient to purchase the food-book
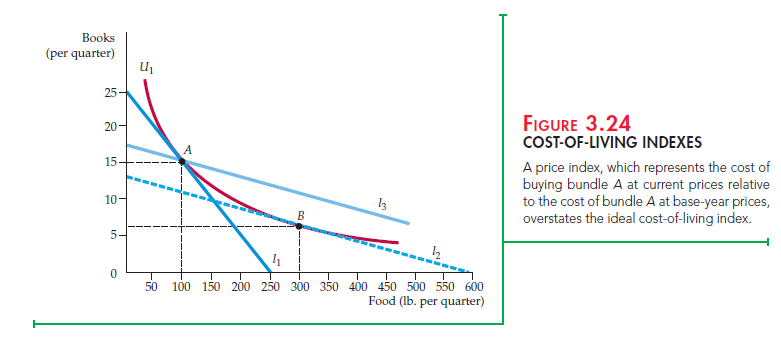
consumption bundle given by point B on line l2 (and tangent to indifference curve U1), where she chooses 300 lbs. of food and 6 books. Note that in doing so, Rachel has taken into account the fact that the price of books has increased relative to food. Therefore, she has substituted toward food and away from books.
The cost to Rachel of attaining the same level of utility as Sarah is given by
$1260 = 300 lbs. of food X $2.20/lb. + 6 books X $100/book
The ideal cost-of-living adjustment for Rachel is therefore $760 (which is $1260 minus the $500 that was given to Sarah). The ideal cost-of-living index is
$1260/$500 = 2.52
Our index needs a base year, which we will set at 2000 = 100, so that the value of the index in 2010 is 252. A value of 252 implies a 152 percent increase in the cost of living, whereas a value of 100 would imply that the cost of living has not changed. This ideal cost-of-living index represents the cost of attaining a given level of utility at current (2010) prices relative to the cost of attaining the same utility at base (2010) prices.
2. Laspeyres Index
Unfortunately, such an ideal cost-of-living index would entail large amounts of information. We would need to know individual preferences (which vary across the population) as well as prices and expenditures. Actual price indexes are therefore based on consumer purchases, not preferences. A price index that uses a fixed consumption bundle in the base period is called a Laspeyres price index. The Laspeyres price index answers the question: What is the amount of money at current-year prices that an individual requires to purchase the bundle of goods and services that was chosen in the base year divided by the cost of purchasing the same bundle at base-year prices?
The Laspeyres price index was illustrated in Figure 3.24. Calculating a Laspeyres cost-of-living index for Rachel is a straightforward process. Buying 100 pounds of food and 15 books in 2010 would require an expenditure of $1720 (100 X $2.20 + 15 X $100). This expenditure allows Rachel to choose bundle A on budget line l3 (or any other bundle on that line). Line l3 was constructed by shifting line l2 outward until it intersected point A. Note that l3 is the budget line that allows Rachel to purchase, at current 2010 prices, the same consumption bundle that her sister purchased in 2000. To compensate Rachel for the increased cost of living, we must increase her discretionary budget by $1220. Using 100 as the base in 2000, the Laspeyres index is therefore
100 X $1720/$500 = 344
COMPARING IDEAL COST-OF-LIVING AND LASPEYRES INDEXES In our example, the Laspeyres price index is clearly much higher than the ideal price index. Does a Laspeyres index always overstate the true cost-of-living index? The answer is yes, as you can see from Figure 3.24. Suppose that Rachel was given the budget associated with line l3 during the base year of 2000. She could choose bundle A, but clearly she could achieve a higher level of utility if she purchased more food and fewer books (by moving to the right on line l3). Because A and B generate equal utility, it follows that Rachel is better off receiving a Laspeyres cost-of-living adjustment rather than an ideal adjustment. The Laspeyres index overcompensates Rachel for the higher cost of living, and the Laspeyres cost-of- living index is, therefore, greater than the ideal cost-of-living index.
This result holds generally. Why? Because the Laspeyres price index assumes that consumers do not alter their consumption patterns as prices change. By changing con- sumption, however—increasing purchases of items that have become relatively cheaper and decreasing purchases of relatively more expensive items—consum- ers can achieve the same level of utility without having to consume the same bundle of goods that they did before the price change.
3. Paasche Index
Another commonly used cost-of-living index is the Paasche index. Unlike the Laspeyres index, which focuses on the cost of buying a base-year bundle, the Paasche index focuses on the cost of buying the current year’s bundle. In partic- ular, the Paasche index answers another question: What is the amount of money at current-year prices that an individual requires to purchase the current bundle of goods and services divided by the cost of purchasing the same bundle in the base year?
COMPARING THE LASPEYRES AND PAASCHE INDEXES It is helpful to compare the Laspeyres and the Paasche cost-of-living indexes.
- Laspeyres index: The amount of money at current-year prices that an individ- ual requires to purchase the bundle of goods and services that was chosen in the base year divided by the cost of purchasing the same bundle at base-year prices.
- Paasche index: The amount of money at current-year prices that an individ- ual requires to purchase the bundle of goods and services chosen in the current year divided by the cost of purchasing the same bundle in the base year.
Both the Laspeyres (LI) and Paasche (PI) indexes are fixed-weight indexes: The quantities of the various goods and services in each index remain unchanged. For the Laspeyres index, however, the quantities remain unchanged at base-year levels; for the Paasche they remain unchanged at current-year levels. Suppose generally that there are two goods, food (F) and clothing (C). Let:

Just as the Laspeyres index will overstate the ideal cost of living, the Paasche will understate it because it assumes that the individual will buy the current-year bundle in the base period. In actuality, facing base-year prices, consumers would have been able to achieve the same level of utility at a lower cost by changing their consumption bundles. Because the Paasche index is a ratio of the cost of base-year prices, overstating the cost of the base-year bundle (the denominator in the ratio) will cause the Paasche index itself to be understated.
To illustrate the Laspeyres-Paasche comparison, let’s return to our earlier example and focus on Sarah’s choices of books and food. For Sarah (who went to college in 2000), the cost of buying the base-year bundle of books and food at current-year prices is $1720 (100 lbs. * $2.20/lb. + 15 books * $100/book). The cost of buying the same bundle at base-year prices is $500 (100 lbs * $2/lb. + 15 books * $20/book). The Laspeyres price index, LI, is therefore 100 * $1720/$500 = 344, as reported previously. In contrast, the cost of buying the current-year bundle at current-year prices is $1260 (300 lbs. * $2.20/lb. + 6 books * $100/book). The cost of buying the same bundle at base-year prices is $720 (300 lbs * $2/lb. + 6 books * $20/book). Consequently, the Paasche price index, PI, is 100 * $1260/$720 = 175. As expected, the Paasche index is lower than the Laspeyres index and lower than the ideal index of 252.
4. Price Indexes in the United States: Chain Weighting
Historically, both the CPI and the PPI were measured as Laspeyres price indexes. The overall CPI was calculated each month by the U.S. Bureau of Labor Statistics as the ratio of the cost of a typical bundle of consumer goods and services to the cost during a base period. A CPI for a particular category of goods and services (e.g., housing) would utilize a bundle of goods and services from that category. Similar calculations were done for the PPI using bundles of intermediate and wholesale goods.
We have seen that the Laspeyres index overstates the amount needed to compensate individuals for price increases. With respect to Social Security and other government programs, this means that using the CPI with base weights to adjust retirement benefits would tend to overcompensate most recipients and would thus require greater government expenditure.
While economists have known of this problem for years, it was not until the energy-price shocks of the 1970s, more recent fluctuations in food prices, and concerns surrounding federal deficits that dissatisfaction with the Laspeyres index grew. It was estimated, for example, that a failure to account for changes in computer-buying patterns in response to a sharp decrease in computer prices had caused the CPI to overstate the cost of living substantially.
For this reason, the U.S. government changed the construction of the CPI and the PPI, switching from a simple Laspeyres index to an index in which the base weights are updated every few years. A chain-weighted price index is a cost- of-living index that accounts for changes in quantities of goods and services over time. Chain weighting was not new to the U.S. It had been adopted in 1995 as an improvement to the GDP deflator, a Paasche price index used to deflate measures of gross domestic product (GDP) in order to obtain an estimate of real GDP (GDP adjusted for inflation).13 Using chain-weighted versions of the CPI, PPI, and GDP deflator has reduced the biases associated with the use of simple Laspeyres and Paasche indexes, but because the weights are changed only infre- quently, the biases have not been eliminated.14
Source: Pindyck Robert, Rubinfeld Daniel (2012), Microeconomics, Pearson, 8th edition.
I am glad to be one of many visitors on this great web site (:, regards for putting up.