One of the theorems of Dow Theory is that the ideal market picture consists of an uptrend, top, downtrend, and bottom, interspersed with retracements and consolidations. Figure 6.1 shows what this ideal market picture would look like. This market picture, of course, is never seen in its ideal form. Consider Hamilton’s quote, “A normal market is the kind that never really happens” (May 4, 1911, in Rhea, 1932; pg. 154). The purpose of the ideal market picture is to provide a generalized model of the stock market’s price behavior over time. It is simple and resembles a harmonic without a constant period or amplitude.
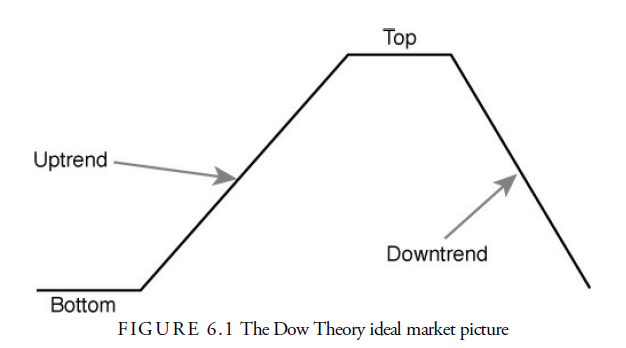
From the modern standpoint of the EMH, this ideal picture is interesting because it presumes that prices oscillate over long periods based on the accumulated emotion of investors as well as the facts of the business cycle. Were market prices to duplicate the business cycle precisely, prices would not oscillate as widely as they do or lead the business cycle by as much as they do. Indeed, some theorists argue that the markets actually cause the business cycle, that confidence or lack of confidence from the markets translates into buying and selling of products (Szala and Holter, 2004). However, for Dow Theory, the picture of the ideal market remains the same regardless of cause.
A second theorem of Dow Theory is that economic rationale should be used to explain stock market action. Remember that Dow created both an industrial average and a railroad average. Although we have no record of Dow’s precise reasoning for doing so, Rhea posited that Dow believed that industrial stocks represented the trend of industry profits and prospects and that railroad stocks represented railroads’ profits and prospects. The profits and prospects for both of these sectors must be in accord with each other. For example, industry may be producing goods, but if railroads are not shipping these goods, then industry must slow down. Goods produced must be shipped to the customer. Railroads must confirm that produced goods are being sold and delivered. Today, of course, the railroad average has been changed to the transportation average to represent airlines, truckers, and other means of shipping goods. Nevertheless, the economic rationale of goods produced and transported is still valid in the industrial sector of the economy. Where Dow’s economic rationale differs from the present is in the service and technology sectors that have become larger in dollar volume than the industrial sector. Some analysts use representations of these newer sectors to form an economic rationale for stock market action.
A third theorem of Dow Theory is that prices trend. A trend is defined as the general direction in which something tends to move. Because we are talking about markets, that “something” is price.
Box 6.2 Some of William Hamilton’s Thoughts on Trends
…on the well-tested rule of reading the averages, a major bull swing continues so long as the rally from a secondary reaction establishes new high points in both averages…. (December 30, 1921, in Rhea, 19032; pg. 188)
An indication [of price trend] remains in force until it is cancelled by another…. (September 23, 1929, in Rhea, 1932; pg. 249)
As we saw in Chapter 2, “The Basic Principle of Technical Analysis—The Trend,” the concept that prices trend is one of the fundamental assumptions of technical analysis. It is the reason why technical analysts can profit. A trend is the basic pattern of all prices. A trend can be upward, downward, or sideways. Obviously, a sideways trend is more difficult to profit from than an upward or downward trend. Technical analysts endeavor to forecast the direction of the market trend. Because trends are the central principle in technical analysis, Chapters 12, “Trends—The Basics,” and 14, “Moving Averages,” focus on how trends are defined, measured, and analyzed by modern-day technical analysts. Right now, we focus on the notion of trend within the Dow Theory.
Dow Theory posited that there are three basic trends in price motion, each defined by time:
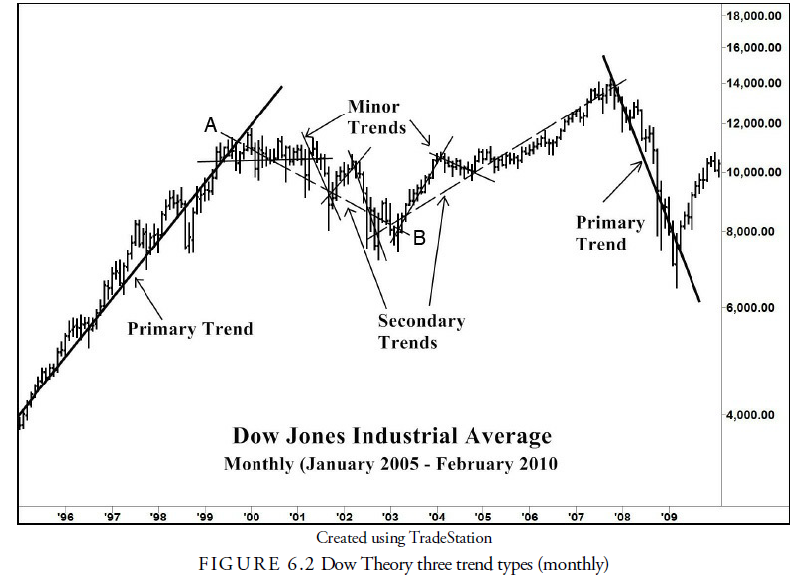
There are three movements of the averages, all of which may be in progress at one and the same time. The first, and most important, is the primary trend: the broad upward or downward movements known as bull or bear markets, which may be of several years duration. The second, and most deceptive movement, is the secondary reaction: an important decline in a primary bull market or a rally in a primary bear market. These reactions usually last from three weeks to as many months. The third, and usually unimportant, movement is the daily fluctuation. (Rhea, 1932)
Figure 6.2 shows graphically how these three trends are interrelated. Let us look at each of these three types of trends—the primary, secondary, and minor—a bit more closely.
The Primary Trend
Correct determination of the primary movement (or trend) is the most important factor in successful speculation. There is no known method of forecasting the extent or duration of a primary movement. (Rhea, 1932)
The primary trend is the longest of the three trend types. It represents the overall, broad, long-term movement of security prices. The duration of this long-term trend can be several years. The primary trend may be an upward trend, which is known as a primary “bull” trend, or it may be a downward trend, referred to as a primary “bear” trend. The general long-run upward trend during the late 1990s in Figure 6.2 indicates a primary bull trend.
Primary bull markets are characterized by three separate phases. The first represents reviving confidence from the prior primary bear market; the second represents the response to increased corporate earnings; and the third is when speculation becomes dominant and prices rise on “hopes and expectations.”
Primary bear markets are long downward price movements, interrupted by occasional rallies, that continue until prices have discounted the worst that is apt to occur. They, too, are characterized by three separate phases: first, abandonment of hopes upon which stocks were purchased; second, selling due to decreased earnings; and third, distress selling, regardless of value, by those who believe the worst is yet to come or who are forced to liquidate.
Source: Kirkpatrick II Charles D., Dahlquist Julie R. (2015), Technical Analysis: The Complete Resource for Financial Market Technicians, FT Press; 3rd edition.
I got good info from your blog