Thus far, we have focused mainly on the sentiment of the uninformed market players. Remember that these market participants often make incorrect market decisions, especially at market extremes. Therefore, the sentiment of the uninformed players is used in a contrarian strategy. Now we center our attention on the sentiment of informed players—those most likely to make correct market decisions.
1. Insiders
The ultimate informed player, at least in individual stocks or commodities, is the insider. An insider is anyone who is a knowledgeable member of a firm that either trades in the commodity underlying the future most important to the firm’s business, such as oil to an oil company or cocoa to a candy company, or who has knowledge of a company’s internal business prospects and results and is a stockholder. Naturally, these people will act for their own benefit, hopefully within the law, and buy and sell based on their knowledge. Under SEC regulations, corporate insiders must report any stock transactions they make within a month; in turn, the SEC reports these transactions weekly. Because insiders are not allowed to profit from transactions in their company’s stock for six months, their actions are a long-term indicator of prospects for the company beyond six months. Investors Intelligence and Vickers Stock Research have found that the compilation of all insider transactions is useful for forecasting the stock market a year out from the reports.
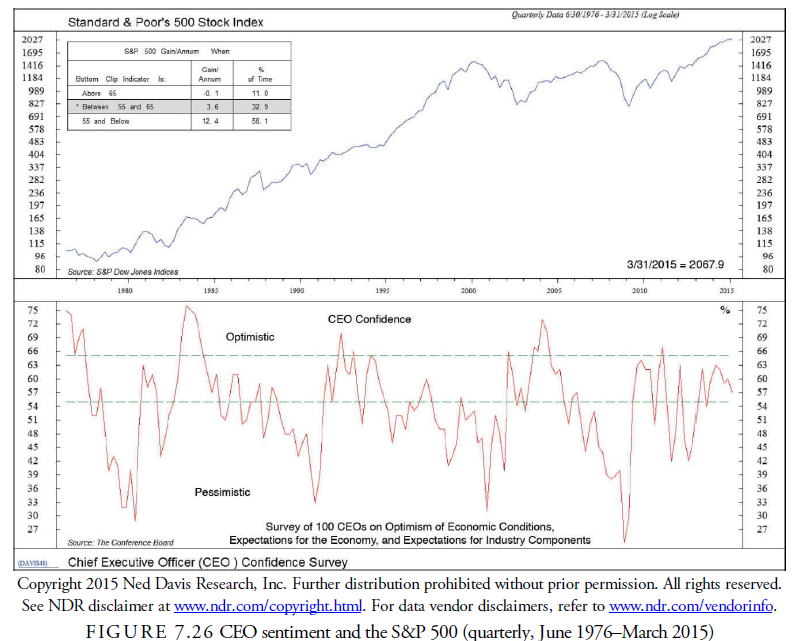
On the other hand, business managers are just people and succumb to the same emotional biases as uninformed market players when they are asked about economic conditions. The Conference Board publishes each quarter the results of a survey of 100 leading CEOs on their feelings about the economy and their expectations. Generally, when they are pessimistic, the market reaches a price bottom. Indeed, Ned Davis Research, Inc. has found that when 45% or more of the CEO’s are pessimistic, the subsequent annual gain in the stock market has been 12.4% (see Figure 7.26).
2. Credit Default Index
Credit default swaps (CDSs) are mostly traded by professionals, but others can purchase them even if they don’t hold bonds. The swaps are priced on the interest rate paid by the guarantor. They represent an insurance- type derivative that allows a bond investor to offset the risk of default of her bond. The bond holder agrees with another investor, the guarantor, to swap the risk of default on her bond for a series of payments. Should the bond default, the guarantor pays the investor the value of the bond and takes possession of it. The CDX index is an index created by Markit (www.markit.com/Product/CDX) that follows the price of CDSs in the U.S. They have other indexes that follow CDSs by industry group and country. Because they can be bought for speculation on financial economic difficulty as well as a hedge against specific bond default, CDSs are purchased by informed players when they believe the economy (and the stock market) are at risk. By optimizing with our moving band test method (see Figure 7.27), we found that they tend to be correct in their assessment of the market. The optimized model showed a 162.6% versus a 71.25% return from the buy- and-hold over a period of 9 years and 8 months. The parameters for upper and lower standard deviation bounds were 2.01 and 1.84 respectively, and the moving average was 31 days.

3. Secondary Offerings
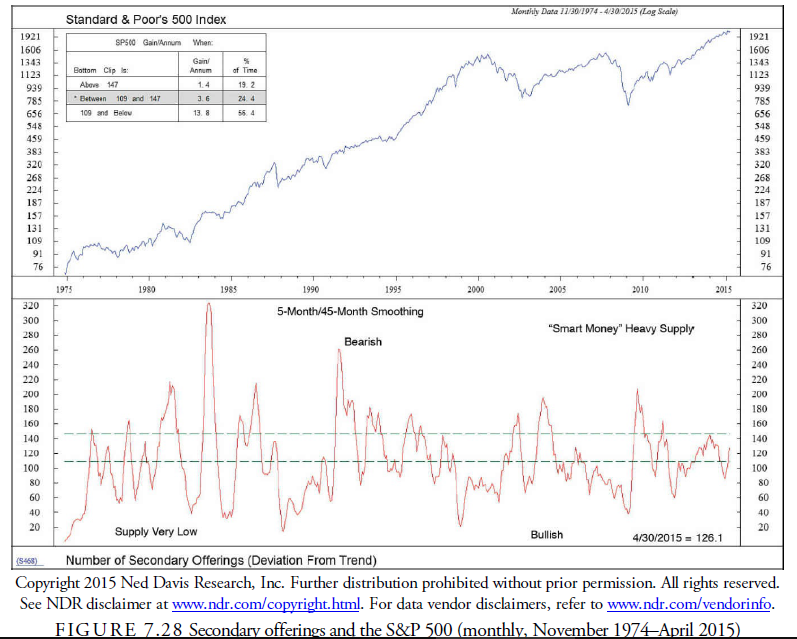
As the stock market rises and long-term interest rates increase, companies tend to offer secondary offerings of stock. Sometimes insiders wanting to sell stock cause this, and sometimes it is caused by a desire to raise cheap capital for expansion. Whatever the reason, increased secondary offerings of stock should increase as the market rises and give warning of a peak. Conversely, when insiders are staying away from the secondary market, the stock market is likely at or close to a bottom. Ned Davis Research, Inc., looked into this phenomenon and found a weak correlation that confirmed the previous thesis. By calculating a ratio of the 5- month simple moving average of secondary offerings to the 45-month moving average, Ned Davis Research, Inc., found that when the ratio rose above 1.47, the percentage gain per year following was 1.4%, whereas when the ratio declined to 109 and below, the gain per year increased to 13.8% (see Figure 7.28).
4. Large Blocks
Large blocks tend to be transacted on behalf of professionals. Large block data is used in several ways. The first is the use of the total number of large block volume relative to the total volume traded. This figure indicates when the large block trader is transacting the most number of shares relative to the market as a whole. Colby (2003) found that when the large block ratio crossed above its 104-week exponential moving average, a buy signal was generated that was profitable 70% of the time with a net profit of 511% over the period from 1983 to 2001. This strategy was only successful on the long side. The short side, which was triggered by the ratio declining below its 104-week average, ended with a loss.
The anxiousness with which stocks are traded is shown by whether buyers trade on upticks or downticks. Aggressive buyers anxious to get a position in a stock will buy large blocks on upticks. The ratio of blocks traded on upticks to those on downticks is, therefore, an indicator of this professional interest in owning stocks.
Ned Davis Research, Inc., found that when large blocks transacted predominately on downticks and then reversed direction, a profitable signal was generated in a study from January 1978 through May 2015 (see Figure 7.29). This seems to suggest that although large blocks trade at a market bottom on downticks during the latter stages of panic, when that panic is over and substantial investors begin to take offers on upticks, they know what they are doing and the stock market is invariably at a bottom. The results of the study showed an annual gain of 11.4% over the buy-and-hold of 8.7% per annum on the long side only. Using large block tick data on the short side was unproductive, thus confirming the directional bias observed by Colby (2003).

Art Merrill studied transactions of large blocks of 50,000 or more shares. Merrill divided the blocks into categories of upticks, downticks, and flat, smoothing each category’s data. He ran a ratio of the uptick average to the downtick average, smoothing that ratio over 52 weeks and calculating the running standard deviation from the smoothed average. This provided significant directional signals of 66%, 81%, and 76% over the next 13 weeks, 26 weeks, and 52 weeks, respectively (Colby 2003).
5. Commitment of Traders (COT) Reports
This study examines whether actual trader position-based sentiment index is useful for predicting returns in the S&P 500 index futures market. The results show that large speculator sentiment is a price continuation indicator, whereas large hedger sentiment is a contrary indicator. Small trader sentiment hardly forecasts future market movements. Moreover, extreme large trader sentiments and the combination of extreme large trader sentiments tend to provide more reliable forecasts. These findings suggest that large speculators possess superior timing ability in the market. (Wang. 2003, p. 891)
With regard to S&P 500 Index futures, we find that large speculator sentiment is a price continuation indicator, whereas large hedger sentiment is a weak contrary indicator. Small trader sentiment does not forecast returns. We show that extreme levels and the combination of extreme levels of sentiments of the two types of large traders may provide a more reliable tool for forecasting. Our result suggests that large speculators may be associated with superior forecasting ability, large hedgers behave like positive feedback traders, and small traders are liquidity traders. (Wang, 2000)
In 1974, Congress created the Commodity Futures Trading Commission (CFTC; www.cftc.gov) to do the following: (1) “protect market users and the public from fraud, manipulation, and abusive practices related to the sale of commodity and financial futures and options” and (2) to “foster open, competitive, and financially sound futures and option markets.”
Each week, the CFTC reports on the large positions held in 22 different futures markets, including stock and bond futures, metals, currency exchange rates, and agriculturals. The reports, called the Commitments of Traders or COT, are for positions held as of Tuesday’s close and are published on Friday. Only those markets with 20 or more traders holding positions large enough to meet the CFTC requirements are included in the reports.
The “public” position is then taken as the difference between total open interest in each future less those positions held by the traders required to report. The trading positions are divided into two major categories: commercial and noncommercial. This nomenclature is an outgrowth of the agricultural origins of the reports. In the financial markets, the commercial traders, individual or institutional, are those who operate in the cash market and are thus called hedgers. The noncommercial participants take speculative positions, change positions more frequently, and are called large speculators. Traditionally and empirically, in the stock market, the large speculators have a better record of anticipating market moves, whereas the hedgers tend to lag behind and follow the trend (Wang, 2000). Thus, an indicator should consider the spread between the large speculator and the hedger. The small speculators tend to be dysfunctional, and their statistics are of little value.
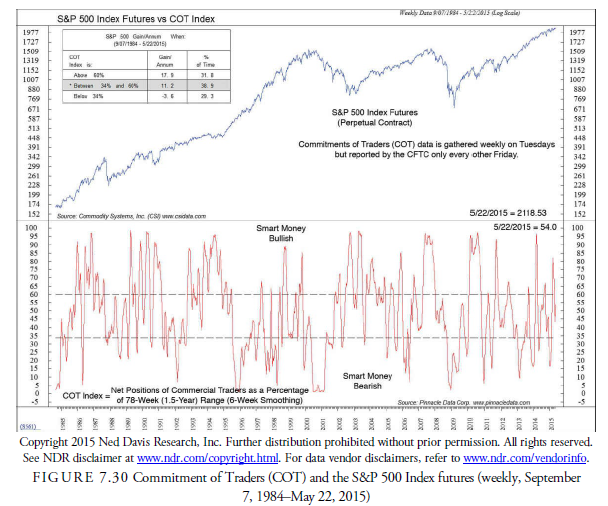
With respect to the S&P 500 futures, Ned Davis Research, Inc., considered only the commercial (hedger) positions and found a correlation between their changes in position and the subsequent market gain or loss (see Figure 7.30). They took the net position of commercial traders as a percentage of the 78-week range, smoothed over six weeks. Later, you will be exposed to an oscillator called the stochastic. This NDR calculation is a long-term stochastic. When the stochastic advances above overbought at 60% (when the commercials have large positions), the S&P 500 futures tended to rise 17.9% per annum. When the commercials were bearish and the stochastic declined to 34.0% and below, the market declined 3.6%. This method is the most reliable one of understanding what the professional, informed traders are doing.
Because the futures market in the stock market is fractionalized by hedging between markets and other financial instruments, the COT figures for any one market might not be reliable. Tom McClellan, editor of the McClellan Market Report (www.mcoscillator.com), combines all the stock futures data into one series of indicators on a dollar-weighted basis and then watches the commercials (hedgers) net long positions as a percentage of the total. He finds that it has recently had a three-week lead to cash stock prices.
A number of tests have used COT data in stock futures, as well as data reported by the CFTC. The most workable systems appear to use smoothed data to normalize the longer-term trends and find that the relationship between commercials and noncommercials are different over time and between futures contracts. It thus behooves the technical analyst to experiment with the different methods for each future contract to see what works best and to update that work continually to expose any changes in relationships between the major players in each market.
Source: Kirkpatrick II Charles D., Dahlquist Julie R. (2015), Technical Analysis: The Complete Resource for Financial Market Technicians, FT Press; 3rd edition.
Greetings! Very helpful advice on this article! It is the little changes that make the biggest changes. Thanks a lot for sharing!