Learn Programming Languages (JavaScript, Python, Java, PHP, C, C#, C++, HTML, CSS)

There’s no question that software programming is a hot career right now. The U.S. Bureau of Labor Statistics projects 21 percent growth for programming jobs from 2018 to 2028, which is more than four times the average for all occupations. What’s more, the median annual pay for a software programmer is about $106,000, which nearly three times the median pay for all U.S. workers.

Not all programming jobs are the same, however. Different roles, companies, and types of software require knowing and understanding different programming languages—and it’s often beneficial to know multiple languages. Trying to break into the field of software programming can be a daunting experience, especially for professionals with no prior programming experience.

Whether you’re new to programming or looking to brush up on your skills, it helps to know which languages are in high demand. Here are 10 of the most popular programming languages of 2020 based on the number of job postings listed on job search site Indeed, the average annual salary for those jobs, and factors such as ease of use and potential for growth.

Top 10 Most Popular Programming Languages

1. Python

Top 10 Popular Programming Languages Chart

Number of jobs: 19,000

Average annual salary: $120,000

Benefits: Python is widely regarded as a programming language that’s easy to learn, due to its simple syntax, a large library of standards and toolkits, and integration with other popular programming languages such as C and C++. In fact, it’s the first language that students learn in the Align program, Gorton says. “You can cover a lot of computer science concepts quickly, and it’s relatively easy to build on.” It is a popular programming language, especially among startups, and therefore Python skills are in high demand.

Drawbacks: Python is not suitable for mobile application development.

Common uses: Python is used in a wide variety of applications, including artificial intelligence, financial services, and data science. Social media sites such as Instagram and Pinterest are also built on Python.

2. JavaScript

Number of jobs: 24,000

Average annual salary: $118,000

Benefits: JavaScript is the most popular programming language for building interactive websites; “virtually everyone is using it,” Gorton says. When combined with Node.js, programmers can use JavaScript to produce web content on the server before a page is sent to the browser, which can be used to build games and communication applications that run directly in the browser. A wide variety of add-ons extend the functionality of JavaScript as well.

Drawbacks: Internet browsers can disable JavaScript code from running, as JavaScript is used to code pop-up ads that in some cases can contain malicious content.

Common uses: JavaScript is used extensively in website and mobile application development. Node.js allows for the development of browser-based applications, which do not require users to download an application.

3. Java

Number of jobs29,000

Average annual salary: $104,000

Benefits: Java is the programming language most commonly associated with the development of client-server applications, which are used by large businesses around the world. Java is designed to be a loosely coupled programming language, meaning that an application written in Java can run on any platform that supports Java. As a result, Java is described as the “write once, run anywhere” programming language.

Drawbacks: Java is not ideal for applications that run on the cloud, as opposed to the server (which is common for business applications). In addition, the software company Oracle, which owns Java, charges a licensing fee to use the Java Development Kit.

Common uses: Along with business applications, Java is used extensively in the Android mobile operating system.

4. C#

Number of jobs: 18,000

Average annual salary: $97,000

Benefits: Microsoft developed C# as a faster and more secure variant of C. It is fully integrated with Microsoft’s .NET software framework, which supports the development of applications for Windows, browser plug-ins, and mobile devices. C# offers shared codebases, a large code library, and a variety of data types.

Drawbacks: C# can have a steep learning curve, especially for resolving errors. It is less flexible than languages such as C++.

Common uses: C# is the go-to language for Microsoft ad Windows application development. It can also be used for mobile devices and video game consoles using an extension of the .NET Framework called Mono.

5. C

Number of jobs: 8,000

Average annual salary: $97,000

Benefits: Along with Python and Java, C forms a “good foundation” for learning how to program, Gorton says. As one of the first programming languages ever developed, C has served as the foundation for writing more modern languages such as Python, Ruby, and PHP. It is also an easy language to debug, test, and maintain.

Drawbacks: Since it’s an older programming language, C is not suitable for more modern use cases such as websites or mobile applications. C also has a complex syntax as compared to more modern languages.

Common uses: Because it can run on any type of device, C is often used to program hardware, such as embedded devices in automobiles and medical devices used in healthcare.

6. C++

Number of jobs: 9,000

Average annual salary: $97,000

Benefits: C++ is an extension of C that works well for programming the systems that run applications, as opposed to the applications themselves. C++ also works well for multi-device and multi-platform systems. Over time, programmers have written a large set of libraries and compilers for C++. Being able to use these utilities effectively is just as important to understanding a programming language as writing code, Gorton says.

Drawbacks: Like C, C++ has complex syntax and an abundance of features that can make it complicated for new programmers. C++ also does not support run-time checking, which is a method of detecting errors or defects while software is running.

Common uses: C++ has many uses and is the language behind everything from computer games to mathematical simulations.

7. Go

Number of jobs1,700

Average annual salary: $93,000

Benefits: Also referred to as Golang, Go was developed by Google to be an efficient, readable, and secure language for system-level programming. It works well for distributed systems, in which systems are located on different networks and need to communicate by sending messages to each other. While it is a relatively new language, Go has a large standards library and extensive documentation.

Drawbacks: Go has not gained widespread use outside of Silicon Valley. Go does not include a library for graphical user interfaces, which are the most common ways that end-users interact with any device that has a screen.

Common uses: Go is used primarily for applications that need to process a lot of data. In addition to Google, companies using Go for certain applications include Netflix, Twitch, and Uber.

8. R

Number of jobs: 1,500

Average annual salary: $93,000

Benefits: R is heavily used in statistical analytics and machine learning applications. The language is extensible and runs on many operating systems. Many large companies have adopted R in order to analyze their massive data sets, so programmers who know R are in great demand.

Drawbacks: R does not have the strict programming guidelines of older and more established languages.

Common uses: R is primarily used in statistical software products.

9. Swift

Number of jobs1,800

Average annual salary: $93,000

Benefits: Swift is Apple’s language for developing applications for Mac computers and Apple’s mobile devices, including the iPhone, iPad, and Apple Watch. Like many modern programming languages, Swift has a highly readable syntax, runs code quickly, and can be used for both client-side and server-side development.

Drawbacks: Swift can only be used on newer versions of iOS 7 and will not work with older applications. As a newer programming language, the code can be unstable at times, and there are fewer third-party resources available to programmers.

Common uses: Swift is used for iOS and macOS applications.

10. PHP

Number of jobs7,000

Average annual salary$81,000

Benefits: PHP is widely used for server-side web development, when a website frequently requests information from a server. As an older language, PHP benefits from a large ecosystem of users who have produced frameworks, libraries, and automation tools to make the programming language easier to use. PHP code is also easy to debug.

Drawbacks: As Python and JavaScript have gained popularity, PHP’s popularity has dropped. PHP is also known for its security vulnerabilities. According to Indeed, most PHP programmers take short-term roles that last less than one year.

Common uses: PHP is the code running content-oriented websites such as Facebook, WordPress, and Wikipedia.

7 Other Programming Languages to Consider

The following programming languages aren’t quite as popular as the 10 listed above, but they are also worth considering if you’re looking to expand your programming options.

  • Dart is optimal for programming applications that need to run on multiple platforms, such as Windows and iOS.
  • Kotlin is used to develop applications for the Android OS.
  • MATLAB is a proprietary language developed by MathWorks and used for scientific research and numerical computing.
  • Perl got its start for programming text, which makes it easy to learn and popular for developing a proof of concept.
  • Ruby is losing traction as compared to other languages, but the Ruby on Rails framework was influential to other, later Web application frameworks for Python, PHP, and JavaScript.
  • Rust emphasizes high performance and security and is useful for applications where many things are happening concurrently.
  • Scala, named as a play on scalable language, is compatible with Java and is useful for cloud-based applications.

Which Programming Language Should You Learn?

Some programmers are able to build a career out of being an expert in one language, but many programmers learn new languages frequently, Gorton says. It’s not uncommon for a professional programmer to be fluent in three or four different languages, he adds.

The type of software you want to develop is one consideration for which programming languages to learn. While there are no concrete rules for what language is used to write what software, a few trends offer some guidance:

  • Web-based startups are more likely to be programming in Python and JavaScript.
  • Larger companies tend to develop their internal software applications using C# or Java and their Web applications using PHP.
  • Programs for data analytics typically use the R and MATLAB programming languages.
  • Embedded devices, such as those in the automotive and healthcare industries, run software written in C, C++, or Rust.
  • Applications that run on the cloud are increasingly written in Go or Scala.
  • Mobile applications are increasingly written in Swift or Kotlin.

Source: Brian Eastwood

Please wait while you are redirected...or Click Here if you do not want to wait.

Create your professional WordPress website without code

A WordPress website is any website that uses WordPress as its content management system (CMS). WordPress powers both the backend of the website (the interface where a user logs in to make changes or add new content) and the frontend (the visible part of the website that your visitors see on the web).

Here are just a few examples of the types of websites you can build with WordPress:

  • Blog – A blog is a special type of website devoted to sharing thoughts, photos, reviews, tutorials, recipes and so much more. Blogs usually display the most recently-published content first.
  • E-commerce website – An e-commerce website allows you to sell goods or services online and collect payment via an online payment system. You can download and install a WordPress e-commerce plugin to extend the default functionality of WordPress so you can have an online store on your website.
  • Business website – Many businesses will benefit from having an online presence in the form of their own website. If your business needs a website for customers to learn about your company and what you have to offer, WordPress is an excellent option. Customers can contact you, ask for a quote, schedule an appointment and much more.
  • Membership website – A membership website allows you to put content behind a paywall or an account login. To access pages or posts, users must login or pay for the content. WordPress can also handle membership websites with additional plugins.
  • Portfolio website – Show off your artwork, design skills and more with a portfolio website built on WordPress.
  • Forum website – A forum website can be a helpful place for users to ask questions or share advice. Believe it or not, many forum websites run on WordPress.
  • Event website – Hosting an event? WordPress makes it easy for you to share your event details and sell tickets.
  • E-learning website – Students can take online courses, track their progress, download resources and much more from an e-learning website.
  • Wedding website – Share the details of your big day with a wedding website built on WordPress. With an array of WordPress wedding themes, you can get a website up quickly and easily.

The possibilities are endless when it comes to customizing a WordPress web. WordPress themes and plugins can add new design options and added functionality. Check out WordPress.org for free themes and plugins.

Please wait while you are redirected...or Click Here if you do not want to wait.

Research methodology: a step-by-step guide for beginners

The book of Research Methodology: A Step-by-Step Guide for Beginners integrates various quantitative and qualitative methodologies into eight practice-based-steps, providing lots of examples throughout to link theory with practice. Written specifically for students with no previous experience of research and research methodology, the writing style is simple and clear and the author presents this complex subject in a straightforward way that empowers readers to tackle research with confidence. The book has been revised and updated to include extended coverage of qualitative research methods in addition to existing comprehensive coverage of quantitative methods. There are also brand new learning features such as reflective questions throughout the text to help students consolidate their knowledge.

[title text=”Main contents” link_text=”See more from basic to advanced” link=”/category/methodology/research-process/”]

[blog_posts style=”normal” col_spacing=”xsmall” columns=”3″ columns__md=”1″ depth_hover=”2″ auto_slide=”5000″ cat=”220″ posts=”3″ offset=”88″ show_date=”false” excerpt_length=”25″ comments=”false” image_height=”60%” image_size=”original” image_hover=”zoom” text_align=”left”]

[blog_posts style=”normal” col_spacing=”xsmall” columns=”3″ columns__md=”1″ depth_hover=”2″ auto_slide=”6000″ cat=”220″ posts=”6″ offset=”82″ show_date=”false” excerpt_length=”25″ comments=”false” image_height=”60%” image_size=”original” image_hover=”zoom” text_align=”left”]

[blog_posts style=”normal” col_spacing=”xsmall” columns=”3″ columns__md=”1″ depth_hover=”2″ auto_slide=”7000″ cat=”220″ posts=”6″ offset=”76″ show_date=”false” excerpt_length=”25″ comments=”false” image_height=”60%” image_size=”original” image_hover=”zoom” text_align=”left”]

[blog_posts style=”normal” col_spacing=”xsmall” columns=”3″ columns__md=”1″ depth_hover=”2″ auto_slide=”8000″ cat=”220″ posts=”6″ offset=”70″ show_date=”false” excerpt_length=”25″ comments=”false” image_height=”60%” image_size=”original” image_hover=”zoom” text_align=”left”]

[blog_posts style=”normal” col_spacing=”xsmall” columns=”3″ columns__md=”1″ depth_hover=”2″ auto_slide=”5000″ cat=”220″ posts=”6″ offset=”64″ show_date=”false” excerpt_length=”25″ comments=”false” image_height=”60%” image_size=”original” image_hover=”zoom” text_align=”left”]

[blog_posts style=”normal” col_spacing=”xsmall” columns=”3″ columns__md=”1″ depth_hover=”2″ auto_slide=”6000″ cat=”220″ posts=”6″ offset=”58″ show_date=”false” excerpt_length=”25″ comments=”false” image_height=”60%” image_size=”original” image_hover=”zoom” text_align=”left”]

[blog_posts style=”normal” col_spacing=”xsmall” columns=”3″ columns__md=”1″ depth_hover=”2″ auto_slide=”7000″ cat=”220″ posts=”6″ offset=”52″ show_date=”false” excerpt_length=”25″ comments=”false” image_height=”60%” image_size=”original” image_hover=”zoom” text_align=”left”]

[blog_posts style=”normal” col_spacing=”xsmall” columns=”3″ columns__md=”1″ depth_hover=”2″ auto_slide=”8000″ cat=”220″ posts=”6″ offset=”46″ show_date=”false” excerpt_length=”25″ comments=”false” image_height=”60%” image_size=”original” image_hover=”zoom” text_align=”left”]

[row style=”small” class=”form-lien-he”]

[col span=”2″ span__sm=”12″]

[/col]
[col span=”4″ span__sm=”12″]

[button text=”Home” color=”secondary” style=”gloss” radius=”5″ depth=”2″ depth_hover=”3″ expand=”true” icon=”icon-star” icon_pos=”left” link=”https://phantran.net/”]

[/col]
[col span=”4″ span__sm=”12″]

[button text=”See basic to advanced” style=”gloss” radius=”5″ depth=”2″ depth_hover=”3″ expand=”true” icon=”icon-checkmark” icon_pos=”left” link=”/category/methodology/research-process/”]

[/col]
[col span=”2″ span__sm=”12″]

[/col]

[/row]

Doing Management Research: A Comprehensive Guide

This book provides refreshing and powerful insights on the challenges of conducting management research from a European perspective. Particularly for someone embarking on a management research career this book will provide valuable guidelines.’ — Ian MacMillan, Wharton School of Business, University of Pennsylvania. This comprehensive volume is distinguished by its balance and pragmatism. The authors who present the various research methods are not proponents but researchers who have applied these methods. The authors who discuss philosophical and strategic issues are not advocates but researchers who have had to confront these issues in their research’ – Bill Starbuck, New York University.

Doing Management Research is a fabulous contribution to our field. Thietart and his colleagues have put together a unique and valuable guide to help management scholars more deeply understand the issues, dynamics and contradictions of executing first class managerial research. This book will hold an important place on the researcher’s desk for years to come’ – Michael Tushman, Harvard Business School ‘This is an excellent in-depth examination of the conduct of management research. It will serve as a valuable resource for management scholars and researchers and is a must read for Ph.D. students in management.’ — Michael Hitt, Arizona State University.

This book will prove to be an excellent guide for those engaged in management research for the first time and an excellent refresher for more experienced scholars. Raymond Thietart and his colleagues should be thanked roundly for this comprehensive volume’ – Gordon Walker, Southern Methodist University, Cox Business School `This textbook makes an outstanding contribution to texts on management research. For researchers considering management research it offers an extensive guide to the research process’ – Paula Roberts, Nurse Researcher Doing Management Research, a major new textbook, provides answers to questions and problems which researchers invariably encounter when embarking on management research, be it quantitative or qualitative.

This book will carefully guide the reader through the research process from beginning to end. An excellent tool for academics and students, it enables the reader to acquire and build upon empirical evidence, and to decide what tools to use to understand and describe what is being observed, and then, which methods of analysis to adopt. There is an entire section dedicated to writing up and communicating the research findings. Written in an accessible and easy-to-use style, this book can be read from cover to cover or dipped into, to clarify particular issues during the research process. Doing Management Research results from the ‘hands-on’ experience of a large group of researchers who have all had to address the different issues raised when undertaking management research. It is anchored in real methodological problems that researchers face in their work. This work will also become one of the most useful reference tools for senior researchers who are looking for answers to epistemological or methodological problems.

[title text=”Main contents” link_text=”See more from basic to advanced” link=”/category/methodology/management-research/”]

[blog_posts style=”normal” col_spacing=”xsmall” columns=”3″ columns__md=”1″ depth_hover=”2″ auto_slide=”5000″ cat=”257″ posts=”3″ offset=”62″ show_date=”false” excerpt_length=”25″ comments=”false” image_height=”60%” image_size=”original” image_hover=”zoom” text_align=”left”]

[blog_posts style=”normal” col_spacing=”xsmall” columns=”3″ columns__md=”1″ depth_hover=”2″ auto_slide=”6000″ cat=”257″ posts=”3″ offset=”59″ show_date=”false” excerpt_length=”25″ comments=”false” image_height=”60%” image_size=”original” image_hover=”zoom” text_align=”left”]

[blog_posts style=”normal” col_spacing=”xsmall” columns=”3″ columns__md=”1″ depth_hover=”2″ auto_slide=”7000″ cat=”257″ posts=”6″ offset=”53″ show_date=”false” excerpt_length=”25″ comments=”false” image_height=”60%” image_size=”original” image_hover=”zoom” text_align=”left”]

[blog_posts style=”normal” col_spacing=”xsmall” columns=”3″ columns__md=”1″ depth_hover=”2″ auto_slide=”8000″ cat=”257″ posts=”6″ offset=”47″ show_date=”false” excerpt_length=”25″ comments=”false” image_height=”60%” image_size=”original” image_hover=”zoom” text_align=”left”]

[blog_posts style=”normal” col_spacing=”xsmall” columns=”3″ columns__md=”1″ depth_hover=”2″ auto_slide=”5000″ cat=”257″ posts=”6″ offset=”41″ show_date=”false” excerpt_length=”25″ comments=”false” image_height=”60%” image_size=”original” image_hover=”zoom” text_align=”left”]

[blog_posts style=”normal” col_spacing=”xsmall” columns=”3″ columns__md=”1″ depth_hover=”2″ auto_slide=”6000″ cat=”257″ posts=”6″ offset=”35″ show_date=”false” excerpt_length=”25″ comments=”false” image_height=”60%” image_size=”original” image_hover=”zoom” text_align=”left”]

[blog_posts style=”normal” col_spacing=”xsmall” columns=”3″ columns__md=”1″ depth_hover=”2″ auto_slide=”7000″ cat=”257″ posts=”6″ offset=”29″ show_date=”false” excerpt_length=”25″ comments=”false” image_height=”60%” image_size=”original” image_hover=”zoom” text_align=”left”]

[blog_posts style=”normal” col_spacing=”xsmall” columns=”3″ columns__md=”1″ depth_hover=”2″ auto_slide=”8000″ cat=”257″ posts=”6″ offset=”23″ show_date=”false” excerpt_length=”25″ comments=”false” image_height=”60%” image_size=”original” image_hover=”zoom” text_align=”left”]

[row style=”small” class=”form-lien-he”]

[col span=”2″ span__sm=”12″]

[/col]
[col span=”4″ span__sm=”12″]

[button text=”Home” color=”secondary” style=”gloss” radius=”5″ depth=”2″ depth_hover=”3″ expand=”true” icon=”icon-star” icon_pos=”left” link=”https://phantran.net/”]

[/col]
[col span=”4″ span__sm=”12″]

[button text=”See basic to advanced” style=”gloss” radius=”5″ depth=”2″ depth_hover=”3″ expand=”true” icon=”icon-checkmark” icon_pos=”left” link=”/category/methodology/management-research/”]

[/col]
[col span=”2″ span__sm=”12″]

[/col]

[/row]

Quantitative Research: Definition, Methods, Types and Examples

What is quantitative research?

Quantitative research is defined as a systematic investigation of phenomena by gathering quantifiable data and performing statistical, mathematical, or computational techniques. Quantitative research collects information from existing and potential customers using sampling methods and sending out online surveys, online polls, questionnaires, etc., the results of which can be depicted in the form of numerical. After careful understanding of these numbers to predict the future of a product or service and make changes accordingly.

An example of quantitative research is the survey conducted to understand the amount of time a doctor takes to tend to a patient when the patient walks into the hospital. A patient satisfaction survey template can be administered to ask questions like how much time did a doctor takes to see a patient, how often does a patient walks into a hospital, and other such questions.

Quantitative outcome research is mostly conducted in the social sciences using the statistical methods used above to collect quantitative data from the research study. In this research method, researchers and statisticians deploy mathematical frameworks and theories that pertain to the quantity under question.

Quantitative research templates are objective, elaborate, and many times, even investigational. The results achieved from this research method are logical, statistical, and unbiased. Data collection happened using a structured method and conducted on larger samples that represent the entire population.

As mentioned above, quantitative research is data-oriented. There are two methods to conduct quantitative research. They are:

  • Primary quantitative research methods
  • Secondary quantitative research methods

[blog_posts style=”push” col_spacing=”small” columns=”2″ columns__md=”1″ depth_hover=”2″ slider_nav_style=”simple” slider_bullets=”true” auto_slide=”8000″ ids=”8436,8604″ show_date=”false” excerpt_length=”0″ comments=”false” image_height=”56.25%” image_size=”original” image_hover=”zoom”]

[blog_posts style=”push” col_spacing=”small” columns=”3″ columns__md=”1″ depth_hover=”2″ slider_nav_style=”simple” slider_bullets=”true” auto_slide=”8000″ ids=”8476,8607,8596″ show_date=”false” excerpt_length=”0″ comments=”false” image_height=”56.25%” image_size=”original” image_hover=”zoom”]

Primary quantitative research methods

There are four different types of quantitative research methods:

Primary quantitative research is the most widely used method of conducting market research. The distinct feature of primary research is that the researcher focuses on collecting data directly rather than depending on data collected from previously done research. Primary quantitative research design can be broken down into three further distinctive tracks, as well as the process flow. They are:

A. Techniques and Types of Studies

There are multiple types of primary quantitative research. They can be distinguished into the four following distinctive methods, which are:

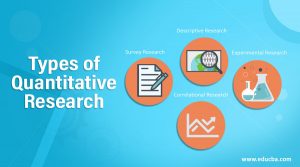
  1. Survey Research:

Survey Research is the most fundamental tool for all quantitative outcome research methodologies and studies. Surveys used to ask questions to a sample of respondents, using various types such as online polls, online surveys, paper questionnaires, web-intercept surveys, etc. Every small and big organization intends to understand what their customers think about their products and services, how well are new features faring in the market and other such details.

By conducting survey research, an organization can ask multiple survey questions, collect data from a pool of customers, and analyze this collected data to produce numerical results. It is the first step towards collecting data for any research.

This type of research can be conducted with a specific target audience group and also can be conducted across multiple groups along with comparative analysis. A prerequisite for this type of research is that the sample of respondents must have randomly selected members. This way, a researcher can easily maintain the accuracy of the obtained results as a huge variety of respondents will be addressed using random selection. Traditionally, survey research was conducted face-to-face or via phone calls but with the progress made by online mediums such as email or social media, survey research has spread to online mediums as well.

Traditionally, survey research was conducted face-to-face or via phone calls but with the progress made by online mediums such as email or social media, survey research has spread to online mediums as well.

There are two types of surveys, either of which can be chosen based on the time in-hand and the kind of data required:

Cross-sectional surveys: Cross-sectional surveys are observational surveys conducted in situations where the researcher intends to collect data from a sample of the target population at a given point in time. Researchers can evaluate various variables at a particular time. Data gathered using this type of survey is from people who depict similarity in all variables except the variables which are considered for research. Throughout the survey, this one variable will stay constant.

  • Cross-sectional surveys are popular with retail, SMEs, healthcare industries. Information is garnered without modifying any parameters in the variable ecosystem.
  • Using a cross-sectional survey research method, multiple samples can be analyzed and compared.
  • Multiple variables can be evaluated using this type of survey research.
  • The only disadvantage of cross-sectional surveys is that the cause-effect relationship of variables cannot be established as it usually evaluates variables at a particular time and not across a continuous time frame.

Longitudinal surveys: Longitudinal surveys are also observational surveys but, unlike cross-sectional surveys, longitudinal surveys are conducted across various time durations to observe a change in respondent behavior and thought-processes. This time can be days, months, years, or even decades. For instance, a researcher planning to analyze the change in buying habits of teenagers over 5 years will conduct longitudinal surveys.

  • In cross-sectional surveys, the same variables were evaluated at a given point in time, and in longitudinal surveys, different variables can be analyzed at different intervals of time.
  • Longitudinal surveys are extensively used in the field of medicine and applied sciences. Apart from these two fields, they are also used to observe a change in the market trend, analyze customer satisfaction, or gain feedback on products/services.
  • In situations where the sequence of events is highly essential, longitudinal surveys are used.
  • Researchers say that when there are research subjects that need to be thoroughly inspected before concluding, they rely on longitudinal surveys.
  1. Correlational research:

A comparison between two entities is invariable. Correlation research is conducted to establish a relationship between two closely-knit entities and how one impacts the other and what are the changes that are eventually observed. This research method is carried out to give value to naturally occurring relationships, and a minimum of two different groups are required to conduct this quantitative research method successfully. Without assuming various aspects, a relationship between two groups or entities must be established.

Researchers use this quantitative research design to correlate two or more variables using mathematical analysis methods. Patterns, relationships, and trends between variables are concluded as they exist in their original set up. The impact of one of these variables on the other is observed along with how it changes the relationship between the two variables. Researchers tend to manipulate one of the variables to attain the desired results.

Ideally, it is advised not to make conclusions merely based on correlational research. This is because it is not mandatory that if two variables are in sync that they are interrelated.

Example of Correlational Research Questions:

  • The relationship between stress and depression.
    The equation between fame and money.
    The relation between activities in a third-grade class and its students.
  1. Causal-comparative research:

This research method mainly depends on the factor of comparison. Also called quasi-experimental research, this quantitative research method is used by researchers to conclude the cause-effect equation between two or more variables, where one variable is dependent on the other independent variable. The independent variable is established but not manipulated, and its impact on the dependent variable is observed. These variables or groups must be formed as they exist in the natural set up. As the dependent and independent variables will always exist in a group, it is advised that the conclusions are carefully established by keeping all the factors in mind.

Causal-comparative research is not restricted to the statistical analysis of two variables but extends to analyzing how various variables or groups change under the influence of the same changes. This research is conducted irrespective of the type of relation that exists between two or more variables. Statistical analysis is used to distinctly present the outcome obtained using this quantitative research method.

Example of Causal-Comparative Research Questions:

  • The impact of drugs on a teenager.
    The effect of good education on a freshman.
    The effect of substantial food provision in the villages of Africa.
  1. Experimental research:

Also known as true experimentation, this research method is reliant on a theory. Experimental research, as the name suggests, is usually based on one or more theories. This theory has not been proven in the past and is merely a supposition. In experimental research, an analysis is done around proving or disproving the statement. This research method is used in natural sciences.Traditional research methods are more effective than modern techniques.

There can be multiple theories in experimental research. A theory is a statement that can be verified or refuted.

After establishing the statement, efforts are made to understand whether it is valid or invalid. This type of quantitative research method is mainly used in natural or social sciences as there are various statements which need to be proved right or wrong.

  • Traditional research methods are more effective than modern techniques.
  • Systematic teaching schedules help children who find it hard to cope up with the course.
  • It is a boon to have responsible nursing staff for ailing parents.

B. Data collection methodologies

The second major step in primary quantitative research is data collection. Data collection can be divided into sampling methods and data collection with the use of surveys and polls.

Data collection methodologies: Sampling methods

There are two main sampling methods for quantitative research: Probability and Non-probability sampling.

Probability sampling: A theory of probability is used to filter individuals from a population and create samples in probability sampling. Participants of a sample are chosen random selection processes. Each member of the target audience has an equal opportunity to be selected in the sample.

There are four main types of probability sampling:

  • Simple random sampling: As the name indicates, simple random sampling is nothing but a random selection of elements for a sample. This sampling technique is implemented where the target population is considerably large.
  • Stratified random sampling: In the stratified random sampling method, a large population is divided into groups (strata), and members of a sample are chosen randomly from these strata. The various segregated strata should ideally not overlap one another.
  • Cluster sampling: Cluster sampling is a probability sampling method using which the main segment is divided into clusters, usually using geographic and demographic segmentation parameters.
  • Systematic sampling: Systematic sampling is a technique where the starting point of the sample is chosen randomly, and all the other elements are chosen using a fixed interval. This interval is calculated by dividing the population size by the target sample size.

Non-probability sampling: Non-probability sampling is where the researcher’s knowledge and experience are used to create samples. Because of the involvement of the researcher, not all the members of a target population have an equal probability of being selected to be a part of a sample.

There are five non-probability sampling models:

  • Convenience sampling: In convenience sampling, elements of a sample are chosen only due to one prime reason: their proximity to the researcher. These samples are quick and easy to implement as there is no other parameter of selection involved.
  • Consecutive sampling: Consecutive sampling is quite similar to convenience sampling, except for the fact that researchers can choose a single element or a group of samples and conduct research consecutively over a significant period and then perform the same process with other samples.
  • Quota sampling: Using quota sampling, researchers can select elements using their knowledge of target traits and personalities to form strata. Members of various strata can then be chosen to be a part of the sample as per the researcher’s understanding.
  • Snowball sampling: Snowball sampling is conducted with target audiences, which are difficult to contact and get information. It is popular in cases where the target audience for research is rare to put together.
  • Judgmental sampling: Judgmental sampling is a non-probability sampling method where samples are created only based on the researcher’s experience and skill.

Data collection methodologies: Using surveys & polls

Once the sample is determined, then either surveys or polls can be distributed to collect the data for quantitative research.

  • Using surveys for primary quantitative research

A Survey is defined as a research method used for collecting data from a pre-defined group of respondents to gain information and insights on various topics of interest. The ease of survey distribution and the wide number of people it can be reached depending on the research time and research objective make it one of the most important aspects of conducting quantitative outcome research.

Fundamental levels of measurement – nominal, ordinal, interval and ratio scales

There are four measurement scales that are fundamental to creating a multiple-choice question in a survey. They are nominal, ordinal, interval, and ratio measurement scales without the fundamentals of which, no multiple-choice questions can be created. Hence, it is crucial to understand these levels of measurement to be able to develop a robust survey.

Use of different question types

To conduct quantitative research, close-ended questions have to be used in a survey. They can be a mix of multiple question types including multiple-choice questions like semantic differential scale questions, rating scale questions, etc.

Survey Distribution and Survey Data Collection

In the above, we have seen the process of building a survey along with the survey design to conduct primary quantitative research. Survey distribution to collect data is the other important aspect of the survey process. There are different ways of survey distribution. Some of the most commonly used methods are:

  • Email: Sending a survey via email is the most widely used and most effective method of survey distribution. The response rate is high in this method because the respondents are aware of your brand. You can use the QuestionPro email management feature to send out and collect survey responses.
  • Buy respondents: Another effective way to distribute a survey and conduct primary quantitative research is to use a sample. Since the respondents are knowledgeable and are on the panel by their own will, responses are much higher.
  • Embed survey on a website: Embedding a survey in a website increases a high number of responses as the respondent is already in close proximity to the brand when the survey pops up.
  • Social distribution: Using social media to distribute the survey aids in collecting a higher number of responses from the people that are aware of the brand.
  • QR code: QuestionPro QR codes store the URL for the survey. You can print/publish this code in magazines, on signs, business cards, or on just about any object/medium.
  • SMS survey: A quick and time-effective way of conducting a survey to collect a high number of responses is the SMS survey.
  • QuestionPro app: The QuestionPro App allows users to circulate surveys quickly, and the responses can be collected both online and offline.

Survey example

An example of a survey is short customer satisfaction (CSAT) survey template that can quickly be built and deployed to collect feedback about what the customer thinks about a brand and how satisfied and referenceable the brand is.

  • Using polls for primary quantitative research

Polls are a method to collect feedback with the use of close-ended questions from a sample. The most commonly used types of polls are election polls and exit polls. Both of these are used to collect data from a large sample size but using basic question types like a multiple-choice question.

C. Data analysis techniques

The third aspect of primary quantitative research design is data analysis. After the collection of raw data, there has to be an analysis of this data to derive statistical inferences from this research. It is important to relate the results to the objective of research and establish the statistical relevance of results.

It is important to consider aspects of research which were not considered for the data collection process and report the difference between what was planned vs. what was actually executed.

It is then required to select precise statistical analysis methods such as SWOT, Conjoint, Cross-tabulation, etc. to analyze the quantitative data.

  • SWOT analysis: SWOT Analysis stands for the acronym of Strengths, Weakness, Opportunities, and Threat analysis. Organizations use this statistical analysis technique to evaluate their performance internally and externally to develop effective strategies for improvement.
  • Conjoint Analysis: Conjoint Analysis is a market analysis method to learn how individuals make complicated purchasing decisions. Trade-offs are involved in the daily activities of an individual, and these reflect their ability to decide from a complex list of product/service options.
  • Cross-tabulation: Cross-tabulation is one of the preliminary statistical market analysis methods which establishes relationships, patterns, and trends within the various parameters of the research study.
  • TURF Analysis: TURF Analysis, an acronym for Totally Unduplicated Reach and Frequency Analysis, is executed in situations where the reach of a favorable communication source is to be analyzed along with the frequency of this communication. It is used for understanding the potential of a target market.

Inferential statistics methods such as confidence interval, margin of error, etc. can then be used to provide results.

Secondary quantitative research methods

Secondary quantitative research or desk research is a research method that involves using already existing data or secondary data. Existing data is summarized and collated to increase the overall effectiveness of research.

This research method involves the collection of quantitative data from existing data sources like the internet, government resources, libraries, research reports, etc. Secondary quantitative research helps to validate the data that is collected from primary quantitative research as well as aid in strengthening or proving or disproving previously collected data.

Following are five popularly used secondary quantitative research methods:

  1. Data available on the internet: With the high penetration of internet and mobile devices, it has become increasingly easy to conduct quantitative research using the internet. Information about most research topics is available online, and this aids in boosting the validity of primary quantitative data as well as proving the relevance of previously collected data.
  2. Government and non-government sources: Secondary quantitative research can also be conducted with the help of government and non-government sources that deal with market research reports. This data is highly reliable and in-depth and hence, can be used to increase the validity of quantitative research design.
  3. Public libraries: Now a sparingly used method of conducting quantitative research, it is still a reliable source of information though. Public libraries have copies of important research that were conducted earlier. They are a storehouse of valuable information and documents from which information can be extracted.
  4. Educational institutions: Educational institutions conduct in-depth research on multiple topics, and hence, the reports that they publish are an important source of validation in quantitative research.
  5. Commercial information sources: Local newspapers, journals, magazines, radio, and TV stations are a great source to obtain data for secondary quantitative research. These commercial information sources have in-depth, first-hand information on economic developments, political agenda, market research, demographic segmentation, and similar subjects.

Quantitative research characteristics

Some distinctive characteristics of quantitative research are:

  • Structured tools: Structured tools such as surveys, polls, or questionnaires are used to gather quantitative data. Using such structure methods helps in collecting in-depth and actionable data from the survey respondents.
  • Sample size: Quantitative research is conducted on a significant sample size that represents the target market. Appropriate sampling methods have to be used when deriving the sample to fortify the research objective
  • Close-ended questions: Closed-ended questions are created per the objective of the research. These questions help collect quantitative data and hence, are extensively used in quantitative research.
  • Prior studies: Various factors related to the research topic are studied before collecting feedback from respondents.
  • Quantitative data: Usually, quantitative data is represented by tables, charts, graphs, or any other non-numerical form. This makes it easy to understand the data that has been collected as well as prove the validity of the market research.
  • Generalization of results: Results of this research method can be generalized to an entire population to take appropriate actions for improvement.

Quantitative research examples

Some examples of quantitative research are:

  1. If any organization would like to conduct a customer satisfaction (CSAT) survey, a customer satisfaction survey template can be used. Through this survey, an organization can collect quantitative data and metrics on the goodwill of the brand or organization in the mind of the customer based on multiple parameters such as product quality, pricing, customer experience, etc. This data can be collected by asking a net promoter score (NPS) question, matrix table questions, etc. that provide data in the form of numbers that can be analyzed and worked upon.
  2. Another example of quantitative research is an organization that conducts an event, collecting feedback from the event attendees about the value that they see from the event. By using an event survey template, the organization can collect actionable feedback about satisfaction levels of customers during various phases of the event such as the sales, pre and post-event, the likelihood of recommending the organization to their friends and colleagues, hotel preferences for the future events and other such questions.

What are the advantages of quantitative research?

There are many advantages of quantitative research. Some of the major advantages of why researchers use this method in market research are:

  • Collect reliable and accurate data: As data is collected, analyzed, and presented in numbers, the results obtained will be extremely reliable. Numbers do not lie. They offer an honest picture of the conducted research without discrepancies and is also extremely accurate. In situations where a researcher predicts conflict, quantitative research is conducted.
  • Quick data collection: A quantitative research is carried out with a group of respondents who represent a population. A survey or any other quantitative research method applied to these respondents and the involvement of statistics, conducting, and analyzing results is quite straightforward and less time-consuming.
  • Wider scope of data analysis: Due to the statistics, this research method provides a wide scope of data collection.
  • Eliminate bias: This research method offers no scope for personal comments or biasing of results. The results achieved are numerical and are thus, fair in most cases.

Qualitative methods: what and why use them?

Qualitative methods, as the name indicates, are methods that do not involve measurement or statistics.  Because the natural sciences have had such resounding success with quantitative methods, qualitative methods are sometimes looked down upon as less scientific.  That is, of course, a mistake.  Qualitative methods have been in use in philosophy, sociology, and history for centuries, and many of the famous studies we refer to in psychology classes every day were actually qualitative!

One qualitative method that goes back a long way is the case study.  When physicians like Sigmund Freud became interested in psychological problems, they continued their tradition of writing and publishing descriptions of their most interesting patients, the treatments they attempted to use, and the progress of the disorder.  Much of the content of abnormal psychology, for example, is built upon these case studies.

Another example is the méthode clinique or clinical method.  This method was particularly well used by Jean Piaget and his followers.  The basic idea is to present a person (in Piaget’s case, usually a young child) with a situation or problem for them to deal with.  The researcher observes how they handle the situation and asks them questions to try to understand the thought processes they are using.  Another version of the méthode clinique is called experimental phenomenology.  One study, for example, asked chess masters and novices to think out loud while playing chess, and analyzed the differences in approach.  One more example is the method of introspection used by Wilhelm Wundt — often considered the founder of scientific psychology — and his students.  Researchers paid careful attention to their own perceptions of simple events like colors, and noted changes in their perceptions following changes in the events.

Probably the oldest qualitative method is naturalistic observation.  This has been used by biologists who study animals in the wild (ethologists) for centuries, and by sociologists studying people’s behavior for nearly as long.  The idea of naturalistic observation is to step back from the situation and make every effort not to interfere.  A biologist studying birds, for example, may construct a blind — a small hut covered with natural materials — so as not to disturb the birds.  Child psychologists often observe children in a similar way.  In experimental schools, the children are often so used to being observed that the researchers don’t even have to hide!  Recently, video and audio technology has allowed us to do the same with people.  Unfortunately, the ethics of spying on people is very questionable!

A variation on naturalistic observation used by some sociologists and psychologists is called participant observation.  A sociologist who is interested in studying the lifestyles of people in some subculture (say a motorcycle gang) may actually join the subculture and interact with the people.  Many anthropologists use this technique as well.  In most cases, it is clear to all that the researcher is not really a part of the group, but sometimes the researcher hides his identity as a researcher.

One of the most useful qualitative techniques is interviewing.  It is often a part of all of the preceding methods.  Contrary to what many people believe, interviewing is not easy.  In fact, it is a rare person who is truly skillful at interviewing.  You have to be very careful not to listen to the person you interview through any prejudiced ideas you might have.  You have to make sure you are not leading the person in the direction you would like them to go.  You have to make sure you don’t misinterpret what they say.  In other words, you need to be very aware of your own biases!

Many researchers using qualitative methods adhere to a school of thought called phenomenology, and refer to their methods as phenomenological methods.  Phenomenology is the study of the contents of consciousness — phenomena — and phenomenological methods are ways of describing and analyzing these contents.  Originally, the methods focussed on describing one’s own thought, feelings, and perceptions.  For example, researchers would investigate their own experiences of an emotion such as anger, or cognitive processes like making a decision.  As you can imagine, the problem of biases are even more difficult to handle in these kind of studies.  Many people, if asked about their experiences of anger, might say something like “I could feel the adrenaline flowing through my veins!”  Unfortunately, that is a prejudicial statement based on people’s common knowledge about the presence of adrenaline.  In fact, nobody actually feels adrenaline in their veins!  We may feel muscle tension, or the hair raising in our necks, or a change in our hearing — but not adrenaline in our  veins.

As time went on, other ways of investigating phenomena were added.  For example, the researcher might ask other people to write what are called protocols — naïve descriptions of their experiences — and use them for analysis.  This is done, for example, when the researcher wants to investigate something he or she doesn’t have personal experience with, such as a schizophrenics verbal hallucinations.

There are arguments for and against the use of qualitative methods.  The most common criticisms of qualitative methods revolve around the problem of bias mentioned above:  It is much easier for biases to creep into qualitative studies than into quantitative ones.  The great advantage of measurement is that, once we have agreed upon what constitutes a measure (say, a meter stick), everyone can use it and be fairly confident that what they measure is what anyone else would measure.  If, on the other hand, we say “this looks like navy blue to me,” someone else might say “no, I think it’s purple,” and another person “no, it’s clearly royal blue!”

The arguments for qualitative methods revolve around realism.  Measures do not encompass the whole of an event.  You can ask people to rate their anxiety, but how much will that tell you about what they are actually feeling?  How do you measure something like love or hate?  Or think about the anthropologist looking at a culture:  Does counting the number of artifacts or timing rituals tell you much about their meaning to the people involved?  Or consider a person’s personality:  Do scores on personality tests tell you much about a person’s life or experiences?  Qualitative researchers would say not much!

Although quantitative methods are still preferred in psychology, more and more people are acknowledging that qualitative methods also have an important place.  Not everything about human beings can be understood by measurement, or in laboratories, or by using rats and pigeons.

Numerous specific research methods/instruments are used when conducting qualitative research.

[blog_posts style=”push” col_spacing=”small” columns=”3″ columns__md=”1″ depth_hover=”2″ slider_nav_style=”simple” slider_bullets=”true” auto_slide=”8000″ ids=”8441,8479,8473″ show_date=”false” excerpt_length=”0″ comments=”false” image_height=”56.25%” image_size=”original” image_hover=”zoom”]

[blog_posts style=”push” col_spacing=”small” columns=”3″ columns__md=”1″ depth_hover=”2″ slider_nav_style=”simple” slider_bullets=”true” auto_slide=”8000″ ids=”8494,8596,8601″ show_date=”false” excerpt_length=”0″ comments=”false” image_height=”56.25%” image_size=”original” image_hover=”zoom”]

  • Case Studies
  • Conversation Analysis
  • Field Studies
  • Focus Groups
  • Interviews
  • Naturalistic Observation
  • Participant Observation
  • Ethnography
  • Phenomenology
  • Autoethnography- This bibliography is compiled from a section of Heather Forest’s ILA on Autoethnography & Storytelling. It includes citations for several peer review journal articles that describe recent autoethnographic studies.
  • Grounded Theory Methods Folder- This bibliography contains references historical and recent books on grounded theory methodology and symbolic interactionalism.
  • Critical Discourse Analysis- Books, chapters, journal articles, whole journals, & dissertations.

A Comparison of R, Python, SAS, SPSS and STATA for a Best Statistical Software

Common statistics program packages differ considerably in terms of their strengths, weaknesses, and handling. The decision as to which system is the best fit should be made with care. Changing to a new system can result in high costs for things like new licenses and re-training. This article introduces and contrasts the market leaders – R, Python, SAS, SPSS, and STATA – to help to illustrate their relative pros and cons, and help make the decision a bit easier.

R

R is a popular, open-source statistics environment that can be extended by packages almost at will. R is commonly used with RStudio, a comfortable development environment that can be used locally or in a client-server installation via a web browser. R applications can also be used directly and interactively on the web via Shiny.

Strengths

  • Very large range of functions (well over 2,000 packages)
  • New statistical methods are quickly implemented
  • Very easy to automate and integrate (for example, with Git, LaTeX, ODBC, Oracle R Enterprise, teradataR, Apache Hadoop, Microstrategy, etc.)
  • Very good community support, as well as fee-based support via third-party providers
  • Extensive help resources freely available (manuals, tutorials, and so on)
  • Very powerful and flexible scripting language (e.g. support of object-oriented programming)
  • All common platforms are supported (Windows, Linux, MacOS…)
  • Future-proof due to very large, active developer community

Weaknesses

  • Getting familiar with the R syntax presents a barrier to entry
  • Stability/quality of little-used packages is often not as high as the core distribution
  • Powerful hardware is required when working with very large data sets

Licensing model and cost
R is free and open source: there are no fees for use

Conclusion
Originally, R was only a low-cost alternative for those that could not afford a commercial statistics program. R has outgrown this perception and now trumps the commercial competition in terms of functionality, flexibility, and integrability with other applications. Many competitors (e.g. SPSS) have reacted by integrating R into their programs. The criticism that R is much harder to learn and use than commercial competitors is less valid today with the availability of RStudio. R is a particularly good choice for frequent users that plan to deal more extensively with statistics and don’t want to be restricted by their statistical program.

Python

Python is a fully functional, open, interpreted programming language that has become an equal alternative for data science projects in recent years. Python is particularly well-suited to the Deep Learning and Machine Learning fields, and is also practical as statistics software through the use of packages, which can easily be installed. A variety of development environments are available, such as jupyter, spyder, and PyCharm. Python is a widely-used language that is also popular in fields like web development.

Strengths

    • Powerful, fully-functional programming language
    • Offers the potential for object-oriented, structured, and functional concepts
    • Mature programming language, resulting in unit tests and debugging functionalities, for example
    • A large number of stable packages in the data science sector and beyond
    • Readable, clean syntax
    • Constant development by a large developer community
    • Full availability of the latest Deep Learning and Machine Learning methods
    • Very easy to automate (e.g. via scripts or a web server)
    • Fully integratable (Git, teradata, PySpark, Hadoop, KNIME)
    • Extremely good community support from a large and constantly-growing community
    • Visualizations are appealing and easy to create
    • Professional development environments are available
    • Future-proof due to continued growth in use in scientific and commercial fields

Weaknesses

    • Not all statistical methods are available
    • Some development environments for statistics are still in their infancy
    • High bar of entry due to being a “full” programming language

Licensing model and cost
There are no user fees for the use of Python. However, in some special areas (e.g. text mining) not all packages are released for commercial use.

Conclusion
Python stands out in this summary given that it is a complete programming language suitable for a wide range of applications. In recent years it has also developed into a serious statistics program due to a large number of high-performance packages, and is increasing in popularity. In particular, Python is indispensable for procedures that are more likely to come from the field of computer science, such as Deep Learning. Its advantages are also clear for automation, and in interaction with other programs (which can also be written in Python). Learning Python requires being prepared to learn a complete programming language, though many good tutorials and trainings are available on the subject due to the language’s popularity. A development environment specifically tailored to the data science sector on the level of RStudio, for example, does not (yet) exist.

SAS

SAS Institute offers a professional statistics software that is commonly used in biometrics, clinical research, and in the banking sector.

Strengths

    • Fast integration of new statistical methods, very stable and reliable routines
    • Very good documentation and professional support
    • Numerous modules and interfaces are available, as well as their own Business Intelligence Software (for a fee)
    • Well-suited for handling large data sets
    • Extensive in-house training offered

Weaknesses

    • Different, partly complicated (but powerful) program languages
    • Partially obsolete interface, GUI optional

Licensing model and cost
A one-year license for SAS® Analytics Pro starts at approximately 7,500€. Typically an individual offer will be made, and special conditions exist for those in the education sector, for example.

Conclusion
SAS is a powerful and very stable tool which is particularly well-utilized by large organizations, and has become the quasi-standard for many analyses in the pharmaceutical sector. The software consists of different modules, some of which follow completely different operating concepts, and the training for SAS is correspondingly complex. Compared to other commercial competitors, SAS is one of the most expensive solutions (which is partially driven by its focus on larger companies and organizations).

SPSS

SPSS is considered to be particularly easy to use, and is one of the most widely-used statistics programs. The originally independent provider has since been taken over by IBM.

Strengths

    • Easy to learn (though not always intuitive to use)
    • Expandable via commercial modules (with prices starting around 800€)
    • Extensive literature – especially on introductory topics – available for Windows and MacOS

Weaknesses

    • Stability has suffered from the short, one-year update cycle
    • Despite syntax and script language it is more difficult to automate and integrate into other applications than other solutions.

Licensing model and cost
There are different license types available, starting at approximately 1,200€ per year for IBM SPSS Statistics Base, 2,700€ for the standard version, and 5,400€ for the professional version, on up to about 8,000€ for the premium version (which includes unlimited use and support for one year). Inexpensive (70€) licenses are available for students, with a fixed one-year term. There are also options for monthly subscriptions.

Conclusion
SPSS has the reputation of being the easiest statistics software to use. SPSS is commonly used in universities, particularly in the social sciences and psychology. In more recent versions, the software is developed by IBM, strongly in the direction of a tool which accomplishes evaluations that can be largely automated and do not require special method knowledge from the user. This development has led to the image of SPSS being somewhat degraded in the eyes of the scientific community, where the software has a reputation for being used by users who “click” together results, without understanding what they are doing. In addition, the short release cycle has negatively impacted stability in the past. While SPSS comes with some more specific modules (e.g. for direct marketing), the overall spectrum of well-supported methods is smaller than for R or SAS, for example.

STATA

STATA is a commercial statistical software that is particularly favored by econometricians.

Strengths

    • Wide range of functions – almost every established statistical method can be found in STATA
    • Easily accessible through a GUI
    • Can be automated
    • Compatible with older versions
    • Good support from the STATA community, and extensive literature available
    • Available for Windows, MacOS, and Unix
    • Comparatively inexpensive relative to commercial competitors
    • Investment security ensured by a three-year release cycle

Weaknesses

    • A bit sluggish in terms of incorporating new methods (version updates)
    • Integration with other software is cumbersome
    • Limited to a data set that is open simultaneously

Licensing model and cost
Commercial single-user license (IC) from approximately 730€. Considerable discounts are available when purchasing multiple licenses, and special conditions apply for the education sector.

Conclusion
Although STATA is a mature, very stable, and powerful software, its distribution – especially in companies – is low. For users who value a broad spectrum of methods, stability, a mature operating concept including scripting language and a fair price, STATA is superior to the more expensive commercial competition.

Other Programs

The five programs discussed above are the undisputed market leaders in the field of universally-applicable statistics programs, and they cover almost the entire spectrum of statistical methods.

There are also several programs that have specialized in certain methods, and have thus been able to establish themselves for certain applications. Some of these programs are mentioned – briefly – below:

  • EViews
    EViews is particularly established in econometrics, and focuses on working with time series data. It is primarily used in university economics departments, and economic research institutes. A less powerful alternative for time series analysis is the free software JMulTi, which is implemented in JAVA.
  • SPSS Amos
    A relatively easy to use program for modeling and estimating structural equation models. Alternatives to Amos include LISREL, Mplus and SmartPLS (for partial least-squares).
  • WinBUGS and OpenBUGS
    WinBUGS, and the related open source project OpenBUGS, are tools especially for Bayesian statistics. While OpenBUGS was developed from the commercial software WinBUGS, the efforts for further development are now concentrated on OpenBUGS. Packages exist that integrate the functionality in R with BRugs and R2OpenBUGS. An alternative to BUGS is JAGS (“Just Another Gibbs Sampler”).
  • Mathematica and MATLAB
    These two commercial programs are used for more numerically-oriented problems.

In addition, there are a number of commercial and open source programs that specialize in data mining methods.