Skip to content
    • info@phantran.net
  • Connecting and sharing with us
  • Login
  • About us
    • info@phantran.net
HKT ConsultantHKT Consultant
  • Home
  • Corporate Management
    • Entrepreneurship
      • Startup
      • Entrepreneurship
      • Growth of firm
    • Managing primary activities
      • Marketing
      • Sales Management
      • Retail Management
      • Import – Export
      • International Business
      • E-commerce
      • Project Management
      • Production Management
      • Quality Management
      • Logistics Management
      • Supply Chain Management
    • Managing support activities
      • Strategy
      • Human Resource Management
      • Organizational Culture
      • Information System Management
      • Corporate Finance
      • Stock Market
      • Accounting
      • Office Management
  • Economics of Firm
    • Theory of the Firm
    • Management Science
    • Microeconomics
  • Research Methodology
    • Methodology
      • Research Process
      • Experimental Research
      • Research Philosophy
      • Management Research
      • Writing a thesis
      • Writing a paper
    • Qualitative Research
      • Literature Review
      • Interview
      • Case Study
      • Action Research
      • Qualitative Content Analysis
      • Observation
      • Phenomenology
    • Quantitative Research
      • Statistics and Econometrics
      • Questionnaire Survey
      • Quantitative Content Analysis
      • Meta Analysis
      • Statistical Software
        • STATA
        • SPSS
        • SEM-AMOS
        • SmartPLS
        • Eviews
Introduction to Eviews

EViews is a statistical package for Windows, used mainly for time-series oriented econometric analysis. It is developed by Quantitative Micro Software (QMS), now a part of IHS. Version 1.0 was released in March 1994, and replaced MicroTSP. The TSP software and programming language had been originally developed by Robert Hall in 1965. The current version of EViews is 12, released in November 2020. EViews is

27
Oct
Using EViews for Principles of Econometrics

This manual is a supplement to the textbook Principles of Econometrics, 3rd Edition, by Hill, Griffiths and Lim (John Wiley & Sons, Inc., 2008). It is not in itself an econometrics book, nor is it a complete computer manual. Rather it is a step-by-step guide to using EViews for the empirical examples in Principles

20
Sep
Starting EViews

To launch EViews double click the EViews 6 SV icon on the desktop, if one is present. It should resemble Alternatively, select EViews from the Windows Start Menu. When EViews opens you are presented with the following screen Across the top are Drop Down Menus that make implementing EViews procedures quite simple. Below the

2 Comments

20
Sep
The EViews Help System

Click Help on the EViews menu The resulting menu is 1. EViews help topics First, click on EViews Help Topics. Select Getting Started (Student Version) to obtain basic information about the Student Version of EViews. Selecting User’s Guide/EViews Fundamentals opens a list of chapters that can take you through specifics of working with EViews.

20
Sep
Using a EViews Workfile

As noted earlier all the data for the book Principles of Econometrics is provided as EViews worhfiles. These will be used starting in Chapter 2. To illustrate the basic functioning of EViews we will use an example provided with EViews. Click on Help/EViews Help Topics/User’s Guide/EViews Fundamentals/A Demonstration. The demonstration starts by importing data

1 Comment

20
Sep
Examining Several Series with EViews

Rather than examining one series at a time we can view several. In the workfile window select the series Ml and then while holding down the Ctrl-key select the PR series. Double click inside the blue area to open what is called a Group of variables. Click on Open Group. A spreadsheet view of

20
Sep
Using the Quick Menu of EViews

The spreadsheet view of the data is very powerful. Another key tool is the Quick menu on the EViews workfile menu. The options shown are 1. Changing the sample By selecting Sample from this menu we can change the range of sample observations. Change the sample to 1952:1 to 2003:4 and click OK. 2.

20
Sep
Using EViews Functions

Now we will explore the use of some EViews functions. Select Help/Quick Help Reference/Function Reference. 1. Descriptive statistics functions Select Descriptive Statistics from the list of material links. Some of the descriptive statistics functions listed there are on the next page. In this table of functions you will note that these functions begin with

4 Comments

20
Sep
The Simple Linear Regression Model by using EViews

In this chapter we introduce the simple linear regression model and estimate a model of weekly food expenditure. We also demonstrate the plotting capabilities of EViews and show how to use the software to calculate the income elasticity of food expenditure, and to predict food expenditure from our regression results. 1. OPEN THE WORKFILE

1 Comment

20
Sep
Interval Estimation and Hypothesis Testing by using EViews

1. INTERVAL ESTIMATION For the regression model y = β1 +β2x + e, and under assumptions SR1-SR6, the important result that we use in this chapter is given in equation (3.3) of POE.             ’ Using this result we can show that the interval bk ± tcse(bk) has probability 1-a of containing the true

20
Sep
Prediction, Goodness of Fit and Modeling Issues by using EViews

1. PREDICTION IN THE FOOD EXPENDITURE MODEL In this chapter we continue to work with the simple linear regression model and our model of weekly food expenditure. To begin, open the food expenditure workfile food.wfl. On the EViews menu choose File/Open and then open the file. So that the original file is not altered

20
Sep
The Multiple Linear Regression Model by using EViews

In the simple linear regression model the average value of a dependent variable is modeled as a linear function of a constant and a single explanatory variable. The multiple linear regression model expands the number of explanatory variables. As such it is a simple but important extension that makes linear regression quite powerful. The

20
Sep
Further Inference in the Multiple Regression Model by using EViews

1. F AND CHI-SQUARE TESTS In Chapter 5 we saw how to use EViews to test a null hypothesis about a single coefficient in a regression model. This test can be extended in two ways. We may want to test a single null hypothesis that involves two or more coefficients, or we might want

20
Sep
Nonlinear Relationships by using EViews

1. POLYNOMIALS In microeconomics you studied “cost” curves and “product” curves that describe a firm. Total cost and total product curves are mirror images of each other, taking the standard “cubic” shapes shown in POE Figure 7.1. Average and marginal cost curves, and their mirror images, average and marginal product curves, take quadratic shapes,

20
Sep
Heteroskedasticity by using EViews

1. EXAMINING RESIDUALS In this chapter we return to the example considered in Chapters 2 to 4 where weekly expenditure on food was related to income. Data in the file food.wfl were used to find the following least squares estimates. We are now concerned with whether the error variance for this equation is likely

20
Sep
Dynamic Models, Autocorrelation, and Forecasting by using EViews

1. LEAST-SQUARES RESIDUALS: SUGARCANE EXAMPLE The first example considered in Chapter 9 is an area response model for sugarcane in Bangladesh where area sown to sugarcane A is related to price P by the equation In contrast to earlier chapters where the index used for the observations was mainly i, here we use the

20
Sep
Random Regressors and Moment Based Estimation by using EViews

1. THE INCONSISTENCY OF THE LEAST SQUARES ESTIMATOR To reproduce Figure 10.2, showing the positive correlation between the x and e generated by the Monte Carlo experiment discussed in the text, first we must “create” the true errors e. In a Monte Carlo world we know the true parameters, and that y is created

20
Sep
Simultaneous Equations Models by using EViews

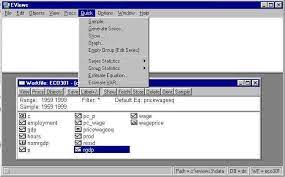
1. EXAMINING THE DATA In this section, the text introduces a two-equation demand and supply model for truffles, a French gourmet mushroom delicacy. To estimate the truffles model in EViews, open the workfile truffles.wfl. Open a Group containing the data. While holding down the Ctrl-key, select P, Q, PS, DI and PF. The first

20
Sep
Nonstationary Time Series Data and Cointegration by using EViews

1. STATIONARY AND NONSTATIONARY VARIABLES Time-series data display a variety of behavior. The data shown in Figure 12.1 is stored in the EViews workfile usa.wfl. They are real gross domestic product (GDP), inflation rate (INF), Federal funds rate (F) and the 3-year Bond rate (B). The changes for real gross domestic product (DG), inflation

20
Sep
VEC and VAR Models by using EViews: An Introduction to Macroeconometrics

1. VEC AND VAR MODELS A VAR model describes a system of equations in which each variable is a function of its own lag and the lag of the other variables in the system. A VEC model is a special form of the VAR for 1(1) variables which are cointegrated. 2. ESTIMATING A VEC

1 Comment

20
Sep
  • 1
  • 2
Theories of the firm
  • Transaction Cost EconomicsTransaction Cost Economics
  • Resource dependence theoryResource dependence theory
  • Systems TheorySystems Theory
  • Social Theories and ConceptsSocial Theories and Concepts
  • Nature and scope of scienceNature and scope of science
  • Institutional TheoryInstitutional Theory
  • Organizational learning theoryOrganizational learning theory
  • Behavioral theory of the firmBehavioral theory of the firm

Most Read Posts

Methodology & Skills
  • Doing Management Research: A Comprehensive GuideDoing Management Research: A Comprehensive Guide
  • Research methodology: a step-by-step guide for beginnersResearch methodology: a step-by-step guide for beginners
  • Qualitative methods: what and why use them?Qualitative methods: what and why use them?
  • A Comparison of R, Python, SAS, SPSS and STATA for a Best Statistical SoftwareA Comparison of R, Python, SAS, SPSS and STATA for a Best Statistical Software
  • Create your professional WordPress website without codeCreate your professional WordPress website without code
  • Learn Programming Languages (JavaScript, Python, Java, PHP, C, C#, C++, HTML, CSS)Learn Programming Languages (JavaScript, Python, Java, PHP, C, C#, C++, HTML, CSS)
  • Quantitative Research: Definition, Methods, Types and ExamplesQuantitative Research: Definition, Methods, Types and Examples

Connecting and sharing with us

... by your free and real actions.

hotlineTComment and discuss your ideas

Enthusiastic to comment and discuss the articles, videos on our website by sharing your knowledge and experiences.

hỗ trợ hkt Respect the copyright

Updating and sharing our articles and videos with sources from our channel.

hỗ trợ hkt Subscribe and like our articles and videos

Supporting us mentally and with your free and real actions on our channel.

HKT Channel - Science Theories

About HKT CHANNEL
About HKT CONSULTANT

Website Structure

Corporate Management
Startup & Entrepreneurship
Management Science
Theories of the firm

HKT Consultant JSC.

      "Knowledge - Experience - Success"
- Email: Info@phantran.net
- Website:
phantran.net

  • Home
  • Corporate Management
    • Entrepreneurship
      • Startup
      • Entrepreneurship
      • Growth of firm
    • Managing primary activities
      • Marketing
      • Sales Management
      • Retail Management
      • Import – Export
      • International Business
      • E-commerce
      • Project Management
      • Production Management
      • Quality Management
      • Logistics Management
      • Supply Chain Management
    • Managing support activities
      • Strategy
      • Human Resource Management
      • Organizational Culture
      • Information System Management
      • Corporate Finance
      • Stock Market
      • Accounting
      • Office Management
  • Economics of Firm
    • Theory of the Firm
    • Management Science
    • Microeconomics
  • Research Methodology
    • Methodology
      • Research Process
      • Experimental Research
      • Research Philosophy
      • Management Research
      • Writing a thesis
      • Writing a paper
    • Qualitative Research
      • Literature Review
      • Interview
      • Case Study
      • Action Research
      • Qualitative Content Analysis
      • Observation
      • Phenomenology
    • Quantitative Research
      • Statistics and Econometrics
      • Questionnaire Survey
      • Quantitative Content Analysis
      • Meta Analysis
      • Statistical Software
        • STATA
        • SPSS
        • SEM-AMOS
        • SmartPLS
        • Eviews
  • About us

Login

Lost your password?