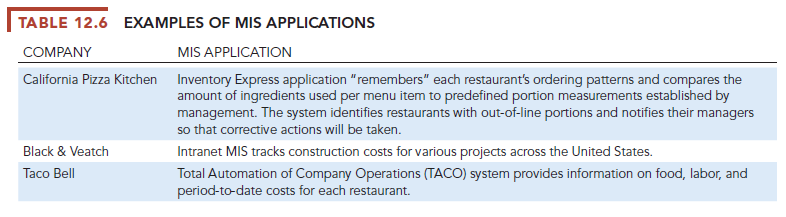
Operational and middle management are generally charged with monitoring the performance of key aspects of the business, ranging from the downtime of machines on a factory floor to the daily or even hourly sales at franchise food stores to the daily traffic at a company’s website. Most of the decisions these managers make are fairly structured. Management information systems (MIS), which we introduced in Chapter 2, are typically used by middle managers to support this type of decision making. Increasingly, middle managers receive these reports online and are able to interactively query the data to find out why events are happening. Managers at this level often turn to exception reports, which highlight only exceptional conditions, such as when the sales quotas for a specific territory fall below an anticipated level or employees have exceeded their spending limits in a dental care plan. Table 12.6 provides some examples of MIS for business intelligence.
1. Support for Semi-structured Decisions
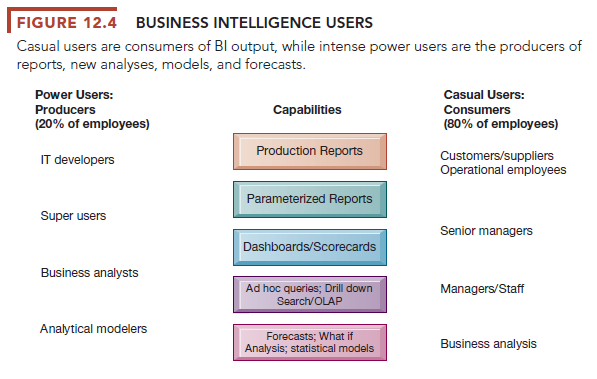
Some managers are “super users” and keen business analysts who want to create their own reports and use more sophisticated analytics and models to find patterns in data, to model alternative business scenarios, or to test specific hypotheses. Decision-support systems (DSS) are the BI delivery platform for this category of users, with the ability to support semi-structured decision making.
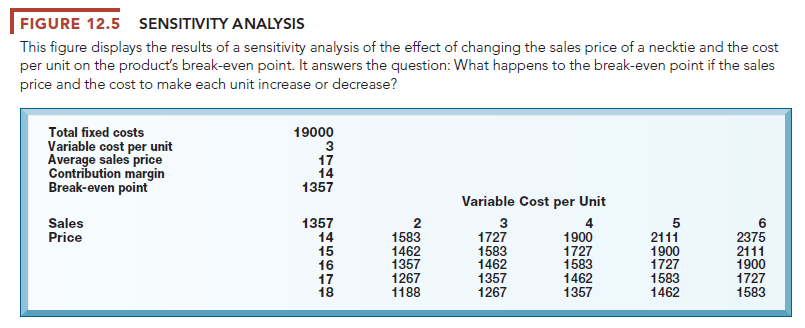
DSS rely more heavily on modeling than MIS, using mathematical or analytical models to perform what-if or other kinds of analysis. “What-if’ analysis, working forward from known or assumed conditions, allows the user to vary certain values in test results to predict outcomes if changes occur in those values. What happens if we raise product prices by 5 percent or increase the advertising budget by $1 million? Sensitivity analysis models ask what-if questions repeatedly to predict a range of outcomes when one or more variables are changed multiple times (see Figure 12.5). Backward sensitivity analysis helps decision makers with goal seeking: If I want to sell 1 million product units next year, how much must I reduce the price of the product?
Chapter 6 described multidimensional data analysis and OLAP as key business intelligence technologies. Spreadsheets have a similar feature for multidimensional analysis called a pivot table, which manager “super users” and analysts employ to identify and understand patterns in business information that may be useful for semi-structured decision making.
Figure 12.6 illustrates a Microsoft Excel pivot table that examines a large list of order transactions for a company selling online management training videos and books. It shows the relationship between two dimensions: the sales region and the source of contact (web banner ad or e-mail) for each customer order. It answers the question: Does the source of the customer make a difference in addition to region? The pivot table in this figure shows that most customers come from the West and that banner advertising produces most of the customers in all the regions.
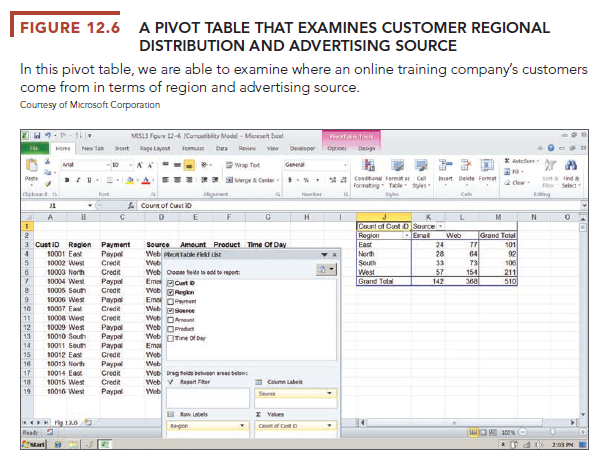
One of the Hands-On MIS projects for this chapter asks you to use a pivot table to find answers to a number of other questions using the same list of transactions for the online training company as we used in this discussion. The complete Excel file for these transactions is available in MyLab MIS. We also provide a Learning Track on creating pivot tables using Excel.
In the past, much of this modeling was done with spreadsheets and small standalone databases. Today these capabilities are incorporated into large enterprise BI systems where they are able to analyze data from large corporate databases. BI analytics include tools for intensive modeling, some of which we described earlier. Such capabilities help Progressive Insurance identify the best customers for its products. Using widely available insurance industry data, Progressive defines small groups of customers, or “cells,” such as motorcycle riders age 30 or above with college educations, credit scores over a certain level, and no accidents. For each “cell,” Progressive performs a regression analysis to identify factors most closely correlated with the insurance losses that are typical for this group. It then sets prices for each cell and uses simulation software to test whether this pricing arrangement will enable the company to make a profit. These analytic techniques make it possible for Progressive to profitably insure customers in traditionally high-risk categories that other insurers would have rejected.
Source: Laudon Kenneth C., Laudon Jane Price (2020), Management Information Systems: Managing the Digital Firm, Pearson; 16th edition.
Some genuinely nice and useful info on this web site, too I believe the layout has wonderful features.