In Chapter 1, we discussed how growing the supply chain surplus is the ultimate goal of a supply chain. Our premise was that increasing the surplus allows for a growth of supply chain profitability, which facilitates an improvement in the financial performance of each member of the supply chain. In this section, we define important financial measures that are reported by a firm and affected by supply chain performance. In later sections, we link supply chain drivers and associated metrics to the various financial measures. The definitions of financial measures in this section are taken from Dyckman, Magee, and Pfeiffer (2011). To illustrate the various financial measures, we use the financial results reported in 2013 by Amazon.com and Nordstrom Inc. and assume a tax rate of 0.35.
From a shareholder perspective, return on equity (ROE) is the main summary measure of a firm’s performance.

Whereas ROE measures the return on investment made by a firm’s shareholders, return on assets (ROA) measures the return earned on each dollar invested by the firm in assets.

Consider the financial performance shown in Table 3-1 for Amazon.com and Nordstrom Inc. In 2013, Amazon {Nordstrom} achieved ROE = 274/9,746 = 2.81 percent {613/1,913 = 32.04 percent} and ROA = [274 + 141 X (1 – 0.35)]/40,159 = 0.91 percent{[613 + 160 X (1 – 0.35)]/8,089 = 8.86 percent}. The difference between ROE and ROA is referred to as return on financial leverage (ROFL). In 2013, Amazon {Nordstrom} had ROFL = 2.81 – 0.91 = 1.90 percent {32.04 — 8.86 = 23.18 percent}. ROFL captures the amount of ROE that can be attributed to financial leverage (such as accounts payable and debt). In Amazon’s case, a significant portion of the financial leverage in 2013 came from accounts payable rather than debt. Thus, an important ratio that defines financial leverage is accounts payable turnover (APT).

In Amazon’s {Nordstrom’s} case, in 2013 APT = 54,181/21,821= 2.48 {7,432/1,415 = 5.25}. The small APT indicates that Amazon was able to use the money it owed suppliers to finance a considerable fraction of its operations. In 2013, Amazon effectively financed its own operations for about 52/2.48 = 20.97 weeks with its suppliers’ money.
ROA can be written as the product of two ratios—profit margin and asset turnover—as shown below:

Thus, a firm can increase ROA by growing the profit margin and/or increasing the asset turnover. In 2013, Amazon {Nordstrom} achieved a profit margin of 647/74,452 = 0.87 percent {1,345/12,148 = 11.07 percent} and an asset turnover of 74,452/40,159 = 1.85 {12,148/8,089 = 1.50}. Despite a lower asset turnover than Amazon, Nordstrom had a better ROA because it achieved much higher profit margins. Profit margin can be improved by receiving better prices or by reducing the various expenses incurred. Although Nordstrom’s higher profit margin can be explained partly by its customers’ willingness to pay for the greater responsiveness that Nordstrom provides, good supply chain management also allows a firm to decrease the expenses incurred to serve customer demand. In Amazon’s case, a significant expense is outbound shipping cost. In its 2013 annual report, the company reported outbound shipping costs of $5.13 billion. After accounting for shipping revenue, the net loss on outbound shipping was reported to be $2.85 billion, about ten times its net income. Clearly, a reduction in outbound shipping costs can have a significant impact on Amazon’s profit margin.
The key components of asset turnover are accounts receivable turnover (ART); inventory turnover (INVT); and property, plant, and equipment turnover (PPET). These are defined as follows:

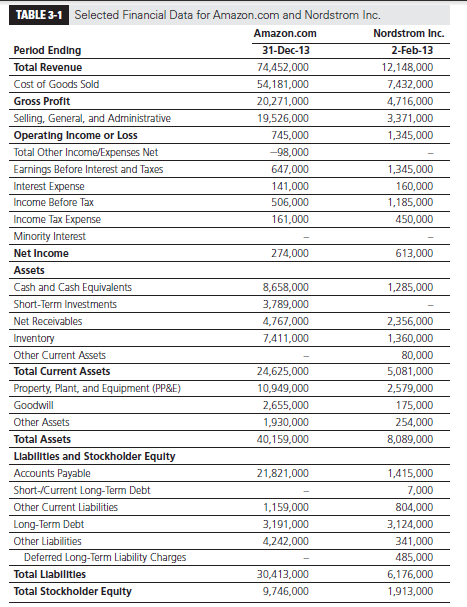
Amazon {Nordstrom} achieved accounts receivable turnover of 74,452/4,767 = 15.62 {12,148/2,356 = 5.16} in 2013. Amazon collected its money from sales relatively quickly (in about 52/15.62 = 3.33 weeks on average in 2013) after it made a sale, whereas Nordstrom took longer (about 10 weeks). Amazon {Nordstrom} turned its inventory about 54,181/7,411 = 7.31 {7,432/1,360 = 5.46} times and had PPET = 74,452/10,949 = 6.80 {12,148/2,579 = 4.71} in 2013. Thus, inventory sat with Amazon {Nordstrom} in 2013 for about 52/7.31 = 7.11 {52/5.46 = 9.52} weeks on average, and each dollar invested in PP&E supported about $6.80 {$4.71} of sales in 2013. Amazon achieved a higher asset turnover than Nordstrom by turning its inventory faster and generating higher revenue per dollar invested in PP&E. Nordstrom, however, achieved a much higher ROA compared with Amazon because it had a much higher profit margin. A company can improve its asset turnover by turning its inventory more quickly or using its existing warehousing and technology infrastructure to support a higher level of sales (or decreasing the warehousing and technology infrastructure needed to support the existing level of sales). A company can improve its profit margin by increasing a customer’s willingness to pay or decreasing operating expense.
Another useful metric is the cash-to-cash (C2C) cycle, which roughly measures the average amount of time from when cash enters the process as cost to when it returns as collected revenue.
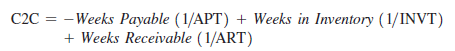
In Amazon’s case, we obtain C2C = -20.97 + 7.11 + 3.33 = -10.53 in 2013. In 2013, Amazon collected its money from the sale of products more than 10 weeks before it had to pay its suppliers. Table 3-2 shows selected financial metrics across industries. It is interesting to observe that the consumer electronics industry has an average C2C cycle of only 9.3 days, whereas medical device manufacturers average more than 200 days.
There are two important measures, however, that are not explicitly part of a firm’s financial statements: markdowns and lost sales. Markdowns represent the discounts required to convince customers to buy excess inventory. Financial statements show only the revenue received from sales, not the revenue that “could” have been received. For General Motors (GM), one of the biggest problems in the early part of the twenty-first century was the discounts required to move excess inventory from dealer lots. These discounts significantly hurt financial performance. In 2010, one of the biggest improvements in financial performance for GM was its ability to sell its cars with much smaller discounts because the supply chain had far less excess inventory. Lost sales represent customer sales that did not materialize because of the absence of products the customer wanted to buy. Every lost sale corresponds to product margin that is lost. Both markdowns and lost sales reduce net income and arguably represent the biggest impact of supply chain performance on the financial performance of a firm. Firms such as Walmart and Zara have achieved strong financial performance in large part because their supply chains allow a better matching of supply and demand, thereby reducing mark- downs and lost sales.

In the next section, we identify key drivers of supply chain performance that influence the financial performance of a firm. Our goal is to understand how these drivers may explain the difference in financial performance between firms such as Amazon and Nordstrom.
Source: Chopra Sunil, Meindl Peter (2014), Supply Chain Management: Strategy, Planning, and Operation, Pearson; 6th edition.
Hello there, just became alert to your blog through Google, and found that it is really informative. I’m going to watch out for brussels. I will be grateful if you continue this in future. A lot of people will be benefited from your writing. Cheers!