Chapter 2 introduced you to the different types of systems used for supporting management decision making. At the foundation of all of these decision support systems are a business intelligence and business analytics infrastructure that supplies the data and the analytic tools for supporting decision making.
1. What Is Business Intelligence?
Business intelligence (BI) is a term used by hardware and software vendors and information technology consultants to describe the infrastructure for warehousing, integrating, reporting, and analyzing data that come from the business environment, including big data. The foundation infrastructure collects, stores, cleans, and makes relevant information available to managers. Think databases, data warehouses, data marts, Hadoop, and analytic platforms, which we described in Chapter 6. Business analytics (BA) is also a vendor-defined term that focuses more on tools and techniques for analyzing and understanding data. Think online analytical processing (OLAP), statistics, models, and data mining, which we also introduced in Chapter 6.
Business intelligence and analytics are essentially about integrating all the information streams produced by a firm into a single, coherent, enterprise-wide set of data and then using modeling, statistical analysis tools, and data mining tools to make sense out of all these data so managers can make better decisions and plans. Purdue College of Agriculture, described in the chapter-opening case, is using business intelligence and analytics to help farmers make some very fine-grained decisions about fertilizer levels, planting depth, and irrigation requirements for small sections of fields or individual plants.
It is important to remember that business intelligence and analytics are products defined by technology vendors and consulting firms. Leading providers of these products include Oracle, SAP, IBM, Microsoft, and SAS. A number of BI and BA products now have cloud and mobile versions.
2. The Business Intelligence Environment
Figure 12.3 gives an overview of a business intelligence environment, highlighting the kinds of hardware, software, and management capabilities that the major vendors offer and that firms develop over time. There are six elements in this business intelligence environment:
- Data from the business environment: Businesses must deal with both structured and unstructured data from many different sources, including big data. The data need to be integrated and organized so that they can be analyzed and used by human decision makers.
- Business intelligence infrastructure: The underlying foundation of business intelligence is a powerful database system that captures all the relevant data to operate the business. The data may be stored in transactional databases or combined and integrated into an enterprise data warehouse or series of interrelated data marts.
- Business analytics toolset: A set of software tools are used to analyze data and produce reports, respond to questions posed by managers, and track the progress of the business using key indicators of performance.
- Managerial users and methods: Business intelligence hardware and software are only as intelligent as the human beings who use them. Managers impose order on the analysis of data using a variety of managerial methods that define strategic business goals and specify how progress will be measured. These include business performance management and balanced scorecard approaches focusing on key performance indicators and industry strategic analyses focusing on changes in the general business environment, with special attention to competitors. Without strong senior management oversight, business analytics can produce a great deal of information, reports, and online screens that focus on the wrong matters and divert attention from the real issues.
- Delivery platform—MIS, DSS, ESS: The results from business intelligence and analytics are delivered to managers and employees in a variety of ways, depending on what they need to know to perform their jobs. MIS, DSS, and ESS, which we introduced in Chapter 2, deliver information and knowledge to different people and levels in the firm-operational employees, middle managers, and senior executives. In the past, these systems could not share data and operated as independent systems. Today, one suite of hardware and software tools in the form of a business intelligence and analytics package is able to integrate all this information and bring it to managers’ desktops or mobile platforms.
- User interface: Business people often learn quicker from a visual representation of data than from a dry report with columns and rows of information. Today’s business analytics software suites feature data visualization tools, such as rich graphs, charts, dashboards, and maps. They also are able to deliver reports on mobile phones and tablets as well as on the firm’s web portal. For example, Tableau Software enables non-technical users to easily create and share customized interactive dashboards to provide business insights from a broad spectrum of data, including data from spreadsheets, corporate databases, and the web. Another example is the process mining software used by Siemens AG to visualize and analyze its business processes (see the Interactive Session on Technology). BA software is adding capabilities to post information on Twitter, Facebook, or internal social media to support decision making in an online group setting rather than in a face-to-face meeting.
3. Business Intelligence and Analytics Capabilities
Business intelligence and analytics promise to deliver correct, nearly real-time information to decision makers, and the analytic tools help them quickly understand the information and take action. There are six analytic functionalities that BI systems deliver to achieve these ends:
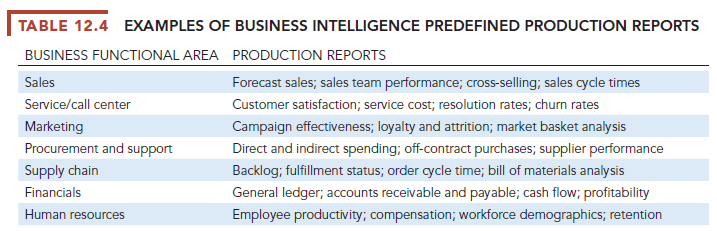
- Production reports: These are predefined reports based on industry- specific requirements (see Table 12.4).
- Parameterized reports: Users enter several parameters as in a pivot table to filter data and isolate impacts of parameters. For instance, you might want to enter region and time of day to understand how sales of a product vary by region and time. If you were Starbucks, you might find that customers in the East buy most of their coffee in the morning, whereas in the Northwest customers buy coffee throughout the day. This finding might lead to different marketing and ad campaigns in each region. (See the discussion of pivot tables in Section 12.4.)

- Dashboards/scorecards: These are visual tools for presenting performance data defined by users.
- Ad hoc query/search/report creation: These allow users to create their own reports based on queries and searches.
- Drill down: This is the ability to move from a high-level summary to a more detailed view.
- Forecasts, scenarios, models: These include the ability to perform linear forecasting and what-if scenario analysis and analyze data using standard statistical tools.
3.1. Predictive Analytics
An important capability of business intelligence analytics is the ability to model future events and behaviors, such as the probability that a customer will respond to an offer to purchase a product. Predictive analytics use statistical analysis, data mining techniques, historical data, and assumptions about future conditions to predict future trends and behavior patterns. Variables that can be measured to predict future behavior are identified. For example, an insurance company might use variables such as age, gender, and driving record as predictors of driving safety when issuing auto insurance policies. A collection of such predictors is combined into a predictive model for forecasting future probabilities with an acceptable level of reliability.
FedEx has been using predictive analytics to develop models that predict how customers will respond to price changes and new services, which customers are most at risk of switching to competitors, and how much revenue will be generated by new storefront or drop-box locations. The accuracy rate of FedEx’s predictive analytics system ranges from 65 to 90 percent.
Predictive analytics are being incorporated into numerous business intelligence applications for sales, marketing, finance, fraud detection, and healthcare. One of the most well-known applications is credit scoring, which is used throughout the financial services industry. When you apply for a new credit card, scoring models process your credit history, loan application, and purchase data to determine your likelihood of making future credit payments on time. Healthcare insurers have been analyzing data for years to identify which patients are most likely to generate high costs.
Many companies employ predictive analytics to predict response to direct marketing campaigns. They are able to lower their marketing and sales costs by focusing their resources on customers who have been identified as more promising. For instance, Slack Technologies, which provides cloud-based team collaboration tools and services for 6.8 million active users, uses predictive analytics to identify customers who are most likely to use its products very frequently and upgrade to its paid services (McDonough, 2017).
3.2. Big Data Analytics
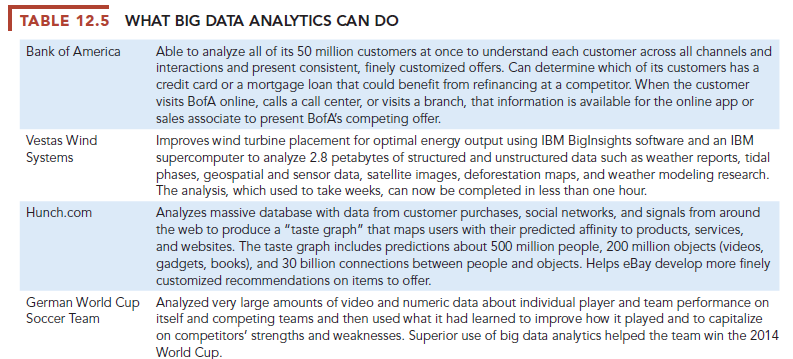
Predictive analytics are starting to use big data from both private and public sectors, including data from social media, customer transactions, and output from sensors and machines. In e-commerce, many online retailers have capabilities for making personalized online product recommendations to their website visitors to help stimulate purchases and guide their decisions about what merchandise to stock. However, most of these product recommendations have been based on the behaviors of similar groups of customers, such as those with incomes under $50,000 or whose ages are between 18 and 25 years. Now some retailers are starting to analyze the tremendous quantities of online and in-store customer data they collect along with social media data to make these recommendations more individualized. These efforts are translating into higher customer spending and customer retention rates. Table 12.5 provides examples of companies using big data analytics.
In the public sector, big data analytics have been driving the movement toward “smart cities,” which make intensive use of digital technology to make better decisions about running cities and serving their residents. Public recordkeeping has produced warehouses full of property transfers, tax records, corporate filings, environmental compliance audits, restaurant inspections, building maintenance reports, mass transit appraisals, crime data, health department stats, public education records, utility reviews, and more. Municipalities are adding more data captured through sensors, location data from mobile phones, and targeted smartphone apps. Predictive modeling programs now inform public policy decisions on utility management, transportation operation, healthcare delivery, and public safety. What’s more, the ability to evaluate how changes in one service affect the operation and delivery of other services enables holistic problem solving that could only be dreamed of a generation ago.
3.3. Operational Intelligence and Analytics
Many decisions deal with how to run the business of these cities on a day-to-day basis. These are largely operational decisions, and this type of business activity monitoring is called operational intelligence. The Internet of Things is creating huge streams of data from web activities, smartphones, sensors, gauges, and monitoring devices that can be used for operational intelligence about activities inside and outside the organization. Software for operational intelligence and analytics enables organizations to analyze these streams of big data as they are generated in real time. The data-driven farming systems described in the chapter-opening case are one example of operational intelligence. Another is the use of data generated by sensors on trucks, trailers, and intermodal containers owned by Schneider National, one of North America’s largest truckload, logistics, and intermodal services providers. The sensors monitor location, driving behaviors, fuel levels, and whether a trailer or container is loaded or empty. Data from fuel tank sensors help Schneider identify the optimal location at which a driver should stop for fuel based on how much is left in the tank, the truck’s destination, and fuel prices en route. The chapter-ending case describes how General Electric (GE) is using operational intelligence to monitor and analyze the performance of generators, jet engines, locomotives, and oil-refining gear and to connect these devices to the cloud.
3.4. Location Analytics and Geographic Information Systems
Decisions are also based on location data. BI analytics include location analytics, the ability to gain business insight from the location (geographic) component of data, including location data from mobile phones, output from sensors or scanning devices, and data from maps. For example, location analytics might help a marketer determine which people to target with mobile ads about nearby restaurants and stores or quantify the impact of mobile ads on in-store visits. Location analytics would help a utility company view and measure outages and their associated costs as related to customer location to help prioritize marketing, system upgrades, and customer service efforts. UPS’s package tracking and delivery-routing systems described in Chapter 1 use location analytics, as does an application used by Starbucks to determine where to open new stores. The Starbucks system analyzes very large amounts of location-based data and demographic data to determine the best places to open more stores without harming sales at other Starbucks locations. A user can see on a map local trade areas, retail clusters, demographics, traffic and transportation nodes, and locations with new offices that might be important sources of customers.
The Starbucks application is an example of a geographic information system (GIS). GIS provide tools to help decision makers visualize problems that benefit from mapping. GIS software ties location data about the distribution of people or other resources to points, lines, and areas on a map. Some GIS have modeling capabilities for changing the data and automatically revising business scenarios.
GIS might be used to help state and local governments calculate response times to natural disasters and other emergencies, to help banks identify the best location for new branches or ATM terminals, or to help police forces pinpoint locations with the highest incidence of crime.
Source: Laudon Kenneth C., Laudon Jane Price (2020), Management Information Systems: Managing the Digital Firm, Pearson; 16th edition.
A powerful share, I simply given this onto a colleague who was doing a little bit evaluation on this. And he in reality bought me breakfast as a result of I discovered it for him.. smile. So let me reword that: Thnx for the deal with! However yeah Thnkx for spending the time to debate this, I really feel strongly about it and love reading more on this topic. If doable, as you become experience, would you mind updating your blog with extra particulars? It’s extremely useful for me. Huge thumb up for this weblog publish!