If you have a significant chi-square invariance test, you need to see what indicators/factor loadings are differing across the groups.You can look at the individual factor loadings for each group and see where you have large differences across the groups. It may just be one construct causing the significant invariance test. Sometimes the differences in loadings are minimal and give you little direction in finding the indicator that is not invariant across the groups. The best way I have found is to perform an individual chi-square difference test on the indicators of each construct. It is a little tedious but is the best way to see exactly where your measurement problem is compared to just eyeballing differences in factor loadings.
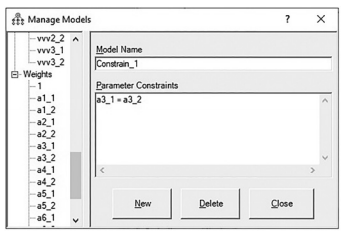
Figure 4.30 Constrain One Path Across the Groups
Let’s say in our example, we think there is an invariance problem with the PositiveWord of Mouth construct. The first thing I want to do is create a new constrained model in AMOS that will allow me to constrain only one factor loading at a time. First, let’s go to the models window in AMOS and double click on the “Unconstrained” model.This will bring up the “Manage Models” pop-up window. I want to select the “New” button at the bottom to form a new model. A new window will pop up where you need to label the model. I like to call the new model simply “Constrain 1”.The first indi- cator inWord of Mouth (WOM1) is constrained to 1 to set the metric, so this item will not help us. The second indicator (WOM2) is labeled a3_1 (or a3_2 for second group). I want to constrain just this indicator to be equal across the groups and to see if there is a significant chi-square difference just for this one factor loading. In the pop-up window, I denote that a3_1 = a3_2. (If you double click on the variables on the left-hand side, it will pull the variable over to the parameter constraint field without having to type it in.) After constraining this one factor loading, I hit the “Close” button and then run the analysis again ![]() . Let’s now look at the output in the “Model Comparison” window.
. Let’s now look at the output in the “Model Comparison” window.
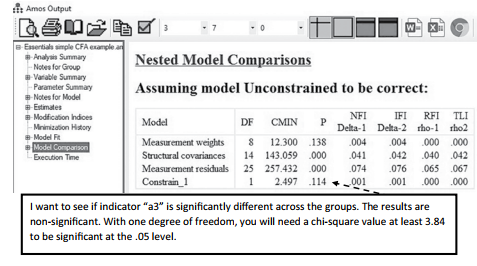
Figure 4.31 Model Comparison of Constrained Parameter
Let’s go back to the AMOS graphics screen and double click the “Constrain 1” model in the models window.This will bring up the pop-up window again. Let’s now look at WOM3 which is labeled as ‘a4’. Erase all the ‘a3’ constraints from the constraint window and replace it with ‘a4’ constraints. Let’s run the analysis again and go back to the “Model Comparison” window.
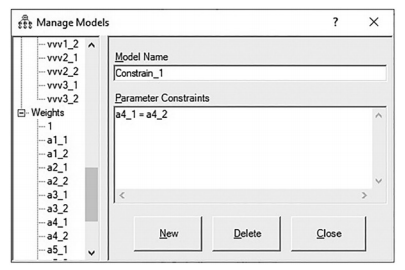
Figure 4.32 Constrain WOM3 across Groups
We can see that constraining just “a4” across the groups did find a significant difference (p-value of 0.013).You can now run a partial metric invariance test where you are constrain- ing the factor loadings to be equal across the groups except for WOM3 (a4), which is now not constrained across the groups. If you are still not achieving a non-significant invariance test, you will need to see if other individual factor loadings are significantly different across the groups.You may have to perform this individual constraint test for multiple constructs if you are having a problem zeroing in on where the invariance problem lies. As I said, this can be time consuming and laborious, but it is necessary to achieve partial metric invariance.
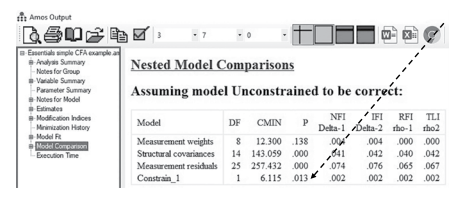
Figure 4.33 Model Comparison Results for WOM3
Another way to assess exactly where you have an invariance issue in your model is to create a separate model comparison test for each factor loading. By doing this, you can see where the potential invariance issues are across the whole model instead of performing multiple tests one at a time. In our example, we have 8 factor loadings that are constrained to be equal across the groups (the factor loadings that are set to “1” are excluded). To perform the invariance test this way, you would need to bring up the Manage Models window, then name the model comparison “a1 test”, and then constrain the a1_1 parameter to be equal to a1_2 parameter. You would repeat this process and create 8 new models that would test each factor loading that is labeled separately.
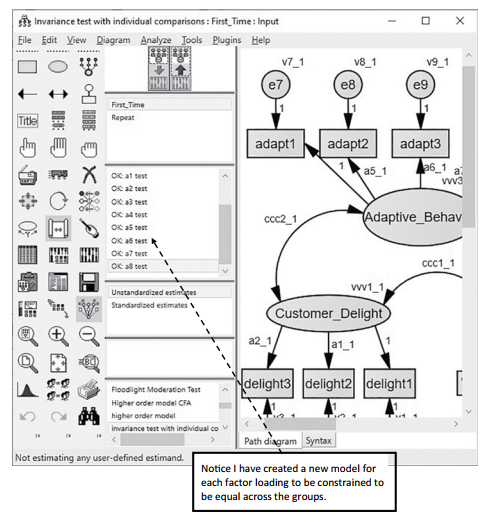
Figure 4.34 Multiple Parameter Constraints Across Groups
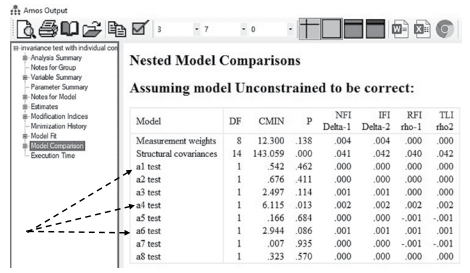
Figure 4.35 Multiple Parameter Constraint Output
After running the analysis again, if we go to the results and click on the Model Comparison link, you will see the individual invariance tests for each factor loading.The test of all 8 factor loadings are presented at once so you can see exactly where your invariance problems lie in your model. In this instance, it appears that only a4 (WOM3) has a significant invariance test. All other factor loadings are invariant across the groups. Again, this is just another option in invariance testing.You can create one new constrained model and test each factor loading one by one, or you can create a constrained model for every factor loading at the beginning and see all the invariance tests at once.
In the event that you cannot achieve even partial metric invariance, you have a serious measurement problem that will not let you proceed. You will ultimately need to go back to the data collection phase and determine how you can assess the same construct across differ- ent groups.
Source: Thakkar, J.J. (2020). “Procedural Steps in Structural Equation Modelling”. In: Structural Equation Modelling. Studies in Systems, Decision and Control, vol 285. Springer, Singapore.
31 Mar 2023
27 Mar 2023
28 Mar 2023
28 Mar 2023
31 Mar 2023
29 Mar 2023