When you open the AMOS graphics program, the software will display a window that looks like it has a white page in the middle of the screen. This is your working area in AMOS.You need to try to keep your model within the confines of the white page because the software program can have issues trying to evaluate a model that is off the white page. One of the many nice functions in AMOS is it has a drag and drop function with your data. Once you tell AMOS what data file to use, you will be able to see a list of all variables in the data file. From there, you can find the variable you want, drag it from the list, and drop it in your white page area. All variables dragged in will be recognized as an observable variable and will be represented by a square from a graphical perspective. If you have drawn an unob- servable construct along with its indicators, you can drag a variable right into an existing box (indicator).
On the left-hand side of the graphic window, you will see a series of blocks. These blocks will provide information about your model while you are still in the graphics win- dow. Next, I provide a breakdown of the information each block presents in the graphics window.
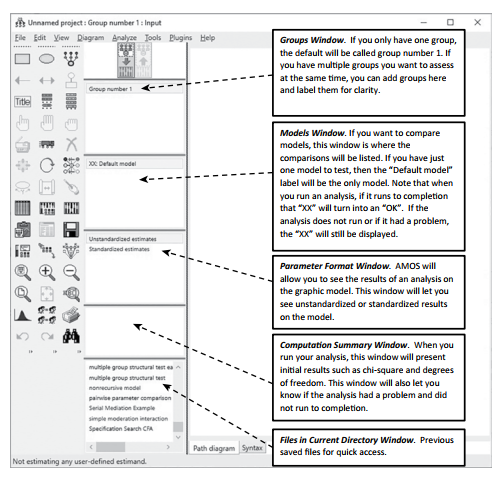
Figure 3.1 Explanation of blocks in AMOS Graphics Window
Along with the boxes on the left-hand side, AMOS will pin a ribbon of icons to the screen. These icons represent the most frequently used functions in AMOS. All of these same func- tions are also offered in the menu bar at the top of the screen. You can move these icons to either side of the screen and customize what icons are seen. There are many more functions and options in AMOS that are not listed in the pinned icon ribbon. Most of those are located at the menu bar at the top of the screen as well.
You do have the option to use a coding format as the input of your structural equation model and I cover how to do this in the advanced topics chapter (Chapter 10).While some will make the argument that you really don’t understand SEM if you are not using a coding (syntax) format (i.e., you are just pushing buttons), I find this argument outdated. Typing out the names of the variables and functions needed does not provide any more insight than using the graphical interface. If anything, I find many researchers using syntax-only programs are so dependent on existing scripts used in previous research that they just cut and paste the syntax code into the program without thinking about whether this script is the most appro- priate one to use. With the software AMOS, the strength of the program is the graphical interface, and I will focus on those options going forward. Saying that, there are some functions that can be accessed only through a coding (syntax) option. Those specific functions will be discussed on how to access and run them via a coding (syntax) method.All other functions will be presented and explained using the graphical interface.
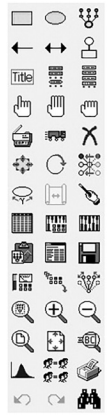
Figure 3.2 AMOS Icon Ribbon
Next, a detailed explanation of all the icons in the pinned ribbon will be presented. An example is provided for each icon to aid in the understanding of each function. All other functions not in the pinned ribbon will initially be discussed in an abbreviated manner.
Throughout this book, these other functions will be discussed in more detail when they become relevant to the analysis discussed.
Source: Thakkar, J.J. (2020). “Procedural Steps in Structural Equation Modelling”. In: Structural Equation Modelling. Studies in Systems, Decision and Control, vol 285. Springer, Singapore.
30 Mar 2023
31 Mar 2023
28 Mar 2023
28 Mar 2023
30 Mar 2023
28 Mar 2023