The quality and reliability of a product reflects the image of an organization and its market potential. In a competitive world, each organization has to strive hard to boost the quality and reliability of its products. Therefore, there is a strong need to develop a workforce that is proficient in the principles and practices of reliability engineering.
The ability of a product to perform as expected over time is one of the principal dimensions of quality. Reliability is an essential aspect of both product and process design. Sophisticated equipment used today in areas such as transportation, communication and medicine require high reliability. High reliability can also provide a competitive advantage for many consumer goods. Japanese automobiles gained large market shares in the 1970s primarily because of their high reliability.
1. Defining Reliability
Reliability is defined as the probability that a device will perform its required function under stated conditions for a specific period of time without requiring repairs and adjustments. Predicting reliability with some degree of confidence is dependant on correctly defining a number of parameters. For instance, choosing the distribution that matches the data is of primary importance. If a correct distribution is not chosen, the results will not be reliable. The failure rates of individual components must be based on a large enough population to truly reflect normal usages in the present day. There are empirical considerations such as determining the slope of the failure rate and calculating the activation energy, as well as environmental factors such as temperature, humidity and vibration. Lastly, there are electrical stressors such as voltage and current.
Reliability engineering can be somewhat abstract in that it involves much statistics; yet it is engineering in its most practical form. Will the design perform its intended mission? Product reliability is seen as a testament to the robustness of the design and the integrity of the quality and manufacturing commitments of an organization.
Reliability is defined as the probability that a product will perform well under specified environmental conditions for a stipulated time period.
This definition has four important elements—probability, time, performance and operating conditions.
- First, reliability is a probability. This means that failure is regarded as a random phenomenon and the likelihood for failures to occur varies over time according to the given probability function. Reliability engineering is concerned with meeting the specified probability of success at a specified statistical confidence level.
- Second, reliability is predicated on performance or “intended function.” Generally, this is taken to mean operation without failure. However, even if individual parts of the system do not fail, but the system as a whole does not do what was intended, then it is still charged against system reliability.
- Third, reliability applies to a specified period of time. In practical terms, this means that a system has a specified chance that it will operate without failure before time. Reliability engineering ensures that components and materials will meet the requirements during the specified time. Units other than time may sometimes be used. For example, the automotive industry might specify reliability in terms of miles; the military might specify reliability of a gun for a certain number of rounds fired. A piece of mechanical equipment may have a reliability rating value in terms of cycles of use.
- Fourth, reliability is restricted to operation under stated operating conditions. This constraint is necessary because it is impossible to design a system for operation under unlimited conditions.
By defining a product’s intended environment, performance characteristics and lifetime, a manufacturer can design and conduct tests to measure the probability of the product’s survival or failure. The analysis of such tests enables better predictions of reliability and improved product and process designs.
Reliability may be inherent reliability, which is the predicted reliability determined by the design of the product or process, and achieved reliability, which is the actual reliability observed during use. Actual reliability can be less than the inherent reliability due to the effects of the manufacturing process and the conditions of use.
2. Reliability Measurement
In practice, reliability is determined by the number of failures per unit of time during the period under consideration called the failure rate (1). The reciprocal of the failure rate is used as an alternative measure. Some products must be scrapped and replaced upon failure, others can be repaired. For items that must be replaced when a failure occurs, the reciprocal of the failure rate (having dimensions of time units per failure) is termed as the mean time to failure (MTTF). For repairable items, the term mean time between failures (MTBF) is used.
MTTF = 1/λ
The lifecycle of the product in terms of failure rate (1) can be categorized into the early failure phase, the random failure phase and the wear-out phase. The three phases of the product lifecycle are shown in a bathtub curve (Figure 14.1). The bathtub curve, widely used in reliability engineering, describes a particular form of the hazard function, which comprises three parts:
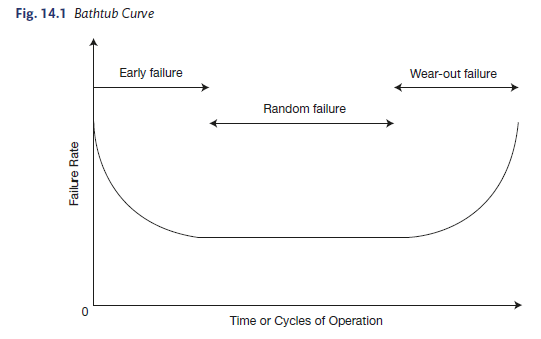
- The first part is a decreasing failure rate known as early failures/infant mortality.
- The second part is a constant failure rate known as random failures/normal life/useful life.
- The third part is an increasing failure rate known as end of life/wear-out failures.
The bathtub curve displayed in Figure 14.1 does not depict the failure rate of a single item, but describes the relative failure rate of an entire population of products over time. Some individual units will fail relatively early (infant mortality failures), others will last until wear-out, and some will fail during the relatively long period typically called normal life. Failures during the infant mortality phase are highly undesirable and are always caused by defects and blunders such as material defects, design blunders and errors in assembly. Normal life failures are normally considered to be random cases of “stress exceeding strength.” However, many failures often considered normal life failures are in fact infant mortality failures. Wear-out is a fact of life due to fatigue or depletion of materials (such as lubrication depletion in bearings). A product’s useful life is limited by its component with the shortest lifespan. A product manufacturer must ensure that all specified materials are adequate to function through the intended product life.
The bathtub curve is typically used as a visual model to illustrate the three key periods of product failure and not calibrated to depict a graph of the expected behaviour for a particular product family. It is rare to have enough short-term and long-term failure information to actually model a population of products with a calibrated bathtub curve.
Gathering enough data about failures to generate as smooth a curve as shown in Figure 14.1 is not always possible. If limited data are available, the failure rate is computed using the following formula:

3. MTTF and MTBF
Mean time to failure (MTTF) is a basic measure of reliability for non-repairable systems. It is the mean time expected until the first failure of a piece of equipment. MTTF is a statistical value and is meant to be the mean over a long period of time and for a large number of units. For constant failure-rate systems, MTTF is the inverse of the failure rate. If failure rate is computed in terms of failures/million hours,
MTTF = 1000,000/Failure Rate for Components with Exponential Distributions
MTTF = 1/λ
Mean time between failures (MTBF) is a basic measure of reliability for repairable items. It can be described as the number of hours that pass before a component, assembly or system fails. It is a commonly used variable in reliability and maintainability analysis. MTBF can be calculated as the inverse of the failure rate for constant failure-rate systems. For example, if a component has a failure rate of two failures per million hours, the MTBF would be the inverse of that failure rate.
MTBF = (1000,000 hours)/(2 Failures) = 500,000 hours
Technically, MTBF should be used only in reference to repairable items, while MTTF should be used for non-repairable items. However, MTBF is commonly used for both repairable and non-repairable items.
MTBF is a vastly misunderstood (and often misused) term. MTBF historically stands for “mean time between failures,” and as such applies only when the underlying distribution has a constant failure rate (e.g. an exponential distribution). However, the use of the term MTBF is confused by the fact that a few reliability practitioners have used it to indicate “mean time before failure,” a case where the underlying distribution may be a wear-out mode. Mean time before failure (often termed mean time to failure or MTTF) describes the average time for the failure of a product, even when the failure rate is increasing over time (wear-out mode). Some units will fail before the mean life, and some will last longer. Thus, a product specified as having an MTTF of 50,000 hours implies that some units will actually operate longer than 50,000 hours without failure.
How does MTBF describe the failure rate? It is quite simple—when the exponential distribution is applied (constant failure rate modeled by the flat bottom of the bathtub curve), the MTBF is equal to the inverse of the failure rate. For example, a product with an MTBF of 3.5 million hours used 24 hours per day:
- MTBF = 1/Failure rate
- Failure rate = 1/MTBF = 1/3,500,000 hours
- Failure rate = 0.000000286 failures/hour
- Failure rate = 0.000286 failures/1,000 hours
- Failure rate = 0.0286 per cent/1,000 hours and since there are 8,760 hours in a year
- Failure rate = 0.25 per cent/year
Note that 3.5 million hours is 400 years. Do we expect that any of these products will actually operate for 400 years? No! Long before 400 years of use, a wear-out mode will become dominant and the population of products will leave the normal life period of the bathtub and start up the wear-out curve. But during the normal life period, the “constant” failure rate will be 0.25 per cent per year, which can also be expressed as an MTBF of 3.5 million hours.
A power supply with an MTBF of 40,000 hours does not mean that the power supply should last for an average of 40,000 hours. According to the theory behind the statistics of confidence intervals, the statistical average becomes the true average as the number of samples increase. An MTBF of 40,000 hours, or 1 year for 1 module, becomes 40,000/2 for two modules and 40,000/4 for four modules. Sometimes failure rates are measured in per cent failed per million hours of operation instead of MTBF. The FIT is equivalent to one failure per billion device hours, which is equivalent to a MTBF of 1,000,000,000 hours. The formula for calculating the MTBF is:

To distinguish between MTTF and MTBF, the concept of suspensions must first be understood. In reliability calculations, a suspension occurs when a destructive test or observation has been completed without observing a failure. MTBF calculations do not consider suspensions whereas MTTF does. MTTF is the number of total hours of service of all devices divided by the number of devices. It is only when all the parts fail with the same failure mode that MTBF converges to MTTF.

Example: Suppose 10 devices are tested for 500 hours. During the test, 2 failures occur. The estimate of the MTBF is:
MTBF = 10 x 500/2 = 2,500 hours/failure
Whereas MTTF = 10 x 500/10 = 500 hours/failure
The cumulative probability P(t} that the product will fail before time instant (t) is given by the area under the probability density function P(t) curve up to the time instant (t).
![]()
Thus, the cumulative probability that the product will not fail before time instant t, which is reliability R(t) is given by
![]()
However, when t = MTBF
![]()
This tells us that the probability that any one particular product will survive to its calculated MTBF is only 36.8 per cent.
Example: A toy manufacturing company has found that the average life of its most popular “robot toy” is 200 hours. Assume that it follows the exponential distribution.
- What is the failure rate?
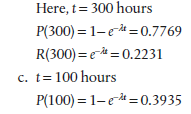
- What is the chance that the toy would last for at least 300 hours?
- What is the chance that the toy would fail within 100 hours?
Solution: This problem may be solved using spread sheet (MS Excel)
Average life = 200 hours
- Failure rate = λ = 1/200 = 0.005
- The chance that it would last for at least 300 hours
There is an in-built function in MS Excel called the exponential distribution function to find the value of P(t},
Example: Twenty air-conditioners designed for use in a space shuttle were operated for 1,000 hours in a test facility. Two of the air-conditioners failed during the test—one after 200 hours and the other after 600 hours. Compute the failure rate and mean time between failures.
Solution:
Failure rate = 1 = Number of failures/Total unit operating hours
Total time of operation = 1000 hours x 20 units = 20,000 unit hours
Non-operating time = 800 hours for the first unit + 400 hours for the second unit = 1,200 unit hours
Operating time = Total time – Non-operating time = 20,000 – 1200 = 18,800 unit hours
Failure rate = 1 = 2/18,800 = 0.000106 failures per unit hour
MTBF = 1/0.000106 = 9,434 hours
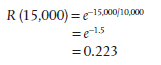
Example: An electronic component has a failure rate of 0.0001 per hour. Calculate the MTTF and the probability that the component will not fail in 15,000 hours.
Solution:
MTTF = 1/λ = 1/0.0001 = 10,000 hours
The probability that the component will not fail in 15,000 hours is
Example: A machine is operated for 10,000 hours and experiences four failures that are immediately repaired. Calculate the MTBF and the failure rate.
MTBF = 10,000/4 = 2,500 hours
Failure rate = λ = 1/2,500 = 0.0004 failures per hour
Source: Poornima M. Charantimath (2017), Total Quality Management, Pearson; 3rd edition.
Hello my family member! I wish to say that this post is awesome, great written and come with almost all significant infos. I would like to look extra posts like this .
Rattling clear web site, appreciate it for this post.