SPC is not something to go into lightly or approach in a halfhearted manner. It requires the time and commitment of key personnel. It involves training and the expenses that go with it. It may even involve hiring one or more new people with specialized skills. There may be expenses for consultants to help get the organization started and checked out in SPC. The organization may have to invest in some new tools or tooling if what is already on hand turns out to be inadequate. But the single most important issue that must be faced when implementing SPC is the culture change that is implicit in using SPC.
Up to this point, the organization has relied on the quality department to ensure the quality of products. With SPC, the process operator must be the one who ensures product quality, and the quality department must step aside, taking on a significantly different role. Before, if operators could do the assembly steps necessary for their processes, that was adequate. Now their scope of activity must be expanded into new areas, and they must be helped to develop the skills needed to cope with the new requirements. Supervisors and middle managers must give operators the latitude and freedom required to perform the new functions effectively. This sounds easier than it actually is. Many people find it difficult to adjust and adapt to new procedures and attitudes.
In addition, when SPC is used, functions that were formerly carried out by individuals will increasingly be performed by collaborative teams. Employees learn that solving problems, using the quality tools, and even defining their own processes are best done by teams of people who bring to the table an array of skills, knowledge, and viewpoints that would be impossible for the individual. Interpreting the control charts, finding root causes of any detected special-cause events, and developing ways to actually improve processes are examples of new tasks that come with SPC. All require team activity.
There is no single right way to implement SPC. What is presented here is a general road map for implementation, covering the major steps in the chronological order in which
they should be introduced. The detail behind each of the steps must be worked out for each unique application. An SPC implementation is one area in which the retention of an expert consultant has merit. For SPC to provide any benefit, the program must be statistically valid, and it takes an expert to know whether it is or not.
Figure 18.21 summarizes the steps involved in implementing SPC. The implementation steps are divided into three phases: preparation, planning, and execution.
1. The Preparation Phase
The preparation phase for SPC includes three steps.
Step 1: Commit to SPC Any endeavor that requires spending money, utilizing human resources, changing the organization’s culture, hiring employees with new skills, or retaining consultants is something to which top management must be committed. The department that forges ahead without that commitment may find itself cut off in mideffort, a situation worse than not having started at all.
Step 2: Form an SPC Committee SPC can take a lot of time, especially at first when employees are getting acquainted with it and are getting the processes online. Unlike total quality,
however, SPC can be delegated to a cross-functional team that is tasked to oversee implementation and execution. The SPC team leader need not be the resident expert (at the beginning), but a statistics expert must be included on the team and that person must be heard. A typical team will be composed of representatives from manufacturing, quality assurance, engineering, finance, and statistics. In a manufacturing plant, the manufacturing member should be the team leader. The function of the team will be to plan and organize the implementation for its unique application, to provide training for the operators, and to monitor and guide the execution phase. Forming the SPC committee is top management’s responsibility.
Step 3: Train the SPC Committee The newly formed SPC committee must receive basic training before its work starts. In a typical situation, the committee members will have had little or no practical experience with statistics. The training must be done by an expert. It is possible to send employees to training courses or bring the expert to the company. At the conclusion of the training period, the members will not have become experts, but they will know enough to set objectives and to determine which processes should be targeted first. At this point, continued help from a statistics expert remains critical.

2. The Planning Phase
The planning phase includes the next five steps.
Step 4: Set SPC Objectives The SPC committee should set objectives for the program. What do we hope to gain from SPC? How will we measure success (at the balance sheet’s bottom line, customer feedback, reduction in scrap, lower cost of quality, or perhaps all of these)? If the team waits until the SPC machinery is in place and producing data to decide what gains are expected, consensus may never be reached on how well or how poorly it is working. Set the objectives. Measure against them. As with all objectives, they should be reviewed from time to time to make sure they are still valid and meaningful. Objectives may be added, eliminated, or changed, but they must be in place and understood by all.
Step 5: Identify Target Processes It is not feasible to attempt to apply SPC to all processes at once. The people involved in designing the SPC application, collecting data and interpreting their meaning, getting the processes under control, and plotting and evaluating control chart data will be in a learning mode for the first several weeks. For that reason, it is important to select just a few pilot processes for the initial implementation. These should be processes that are well understood and that promise to be relatively easy to bring under control. They should also be important processes, ones that have meaning rather than something trivial. The key point to remember is this: select initial processes from among those that stand the best chance of quick success. With some initial successes under its belt, the organization can go on with confidence to the processes that are the most critical.
Consideration should also be given to the flow from one process to another. For example, if there is a production line with four processes, it makes sense to implement SPC in the order of production flow. Trying to introduce it at the end or in the middle of the four processes may prove difficult. If the first three processes feed their defects into the final process, it will be impossible to eliminate the special causes of variation of the fourth. On the other hand, by starting at the beginning of the flow, putting process 1 under control may eliminate one or more of the special causes affecting processes 2 through 4. The idea is to start implementation at the front of a series of processes, not at the back. Selection of the target processes should be done by the SPC committee, with comprehensive, open communication with the process operators.
Step 6: Train Appropriate Operators and Teams The operators and teams who will be directly involved with the collection, plotting, and interpretation of SPC data, and those who will be involved in getting the targeted processes under control, will require training in the use of quality tools and in flowcharting, and perhaps in the use of Five-S and FMEA. Some processes may require the use of design of experiments (DOE). If this is the case, the help of a specialist, both to provide training and to assist with the DOE process, may be needed. Training given at this point must make clear the significance and the objectives of the work to be undertaken. Participants will be the process operators and the engineers and quality specialists who support them. Only the employees who will be involved in the initial SPC projects should be included in the first class. As SPC is spread throughout the plant, it will be necessary to train other operators and teams and their support personnel. But by delaying training until it is time to expand beyond the initial processes, the advantage of just-in-time training will be gained. In addition, you will be able to capitalize on lessons learned from the initial projects. The training needed can typically be accommodated in a one- or two-day session.
Step 7: Ensure Repeatability and Reproducibility of Gauges and Methods All measuring instruments, from simple calipers and micrometers to coordinate measuring machines, must be calibrated and certified for acceptable repeatability and reproducibility performance. For SPC to work, the measured data plotted on the control charts must be reliable. A gauge that cannot repeat the same measurement with the same operator consistently or one that is so difficult or idiosyncratic in its use that no two operators can obtain the same data will not work in an SPC environment. The particular application will determine the range of variability that is acceptable in measuring instruments. It must then be verified that each instrument to be used is capable—and that all the people who will be using the instrument are adequately trained in its use. This must be done before Step 10.
Step 8: Delegate Responsibility for Operators to Play a Key Role As the last step in the planning phase, just before SPC execution is to begin, management should delegate to the process operators’ responsibility for maintaining the SPC control charts, collecting and plotting the data, and taking appropriate action. Let the operators know that these functions are theirs, but make certain everyone else knows it, too.
3. The Execution Phase
The execution phase includes nine steps.
Step 9: Flowchart the Process The first step in the SPC execution phase, taking the broad perspective regarding SPC’s boundaries, is flowcharting or characterizing the process to which SPC will be applied. Only when a graphic representation of the entire process exists—including its inputs, its outputs, and all the steps between—can the process be fully understood. Invariably, flowcharting will reveal process features or factors that were not known to everyone. After the flowchart has been completed and everyone agrees that it represents the way the process actually works, a large version should be produced on poster board and permanently placed in open view at the process location. It will provide invaluable information and may even suggest process improvements later on. Members of the SPC team should help, but the development of the process flowcharts should be the responsibility of special teams composed of the process operators, their internal suppliers and customers, and appropriate support members. (Support personnel may include engineers, materials specialists, financial specialists, etc., as needed.)
Step 10: Eliminate the Special Causes of Variation Now that participants understand the process, it is time to identify and eliminate the special causes of variation. This is best begun through the use of the cause-and-effect diagram, which was discussed in Chapter 15 as one of the seven total quality tools. The cause-and-effect diagram will list all the factors (causes) that might impact the output in a particular way (effect). Then by applying the other tools, such as Pareto charts, histograms, and stratification, the special causes can be identified and eliminated. Until the special causes that are working on the process are eliminated, the next steps will be difficult or impossible to complete. Elimination of the special causes should be a team effort among the process operators, internal process suppliers and customers, engineers, and quality assurance personnel, with additional help from other departments as required. For example, if materials are a factor, the purchasing department might become involved. Be sure to keep the operators at the center of the activity, as this will give them ownership as well as valuable experience.
Step 11: Develop Control Charts With the absence of special causes, it is now possible to observe the process unencumbered by external factors. The statistics expert, or consultant, can now help develop the appropriate control charts and calculate valid upper and lower control limits and process averages. Selection of the control chart type will be determined by the kind of data to be used. (See Figure 18.19.)
Step 12: Collect and Plot SPC Data; Monitor With the special causes removed and with the process running without tweaking (frequent minor adjustments to one or more process factors), the process operator takes the sample data (as specified by the statistics expert) and plots it on the control chart at regular intervals. The operator carefully observes the location of the plots, knowing that they should be inside the control limits, with the pattern varying randomly about the process average if the process is in control.
Step 13: Determine Process Capability Before going further, it is important to determine whether the process is capable of doing what is expected of it. For example, if the process output is to be metal parts with a specified length of between 5.999 and 6.001 inches, but the process turns out as many pieces outside those dimensions as it does within, the process is not capable. The process is capable if its frequency distribution is a bell-shaped curve centered on the specification average—in this case, 6 inches—and with the ±3s spread coincident with, or narrower than, the specification limits. With the bell curve centered on the specification average and the specification limits coincident with the ±3s spread of the bell curve, we could expect three nonconforming parts out of 1,000. If the specification limits are inside the ±3s spread, then the defect rate will be higher; if they are outside (the bell curve is narrower than the limits), the defect rate will be lower.
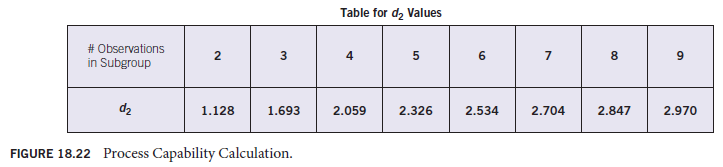
Two methods exist for determining process capability. The first assumes that the bell curve is centered on the specification average and is called Cp. The second does not assume alignment of the process average and the specification average and is called Cp^. Figure 18.22 explains the procedures for calculating these capability indices. As we have already learned, it is possible to have a process that is in control and still not capable of meeting the customer’s specifications. When this is the case, it is up to management to replace or upgrade the process capability, which may require the purchase of new equipment.
Step 14: Respond to Trends and Out-of-Limits Data As data are plotted, the operator must respond to any penetration of the control limits or to any run of data above or below the process average line. Either of these is an indication that something is wrong within the process or that some external factor (a special cause) has influenced the process. With experience, operators may be able to handle many of these situations on their own, but when they cannot, it is important that they summon help immediately. The process should be stopped until the cause is identified and removed. This is one of the most important functions of SPC—letting the operator know there is a problem early enough to prevent the production of defective products that must be scrapped or reworked. The only way to respond in such cases is to immediately eliminate the problem. This is another application for team (usually ad hoc) participation.
Step 15: Track SPC Data The SPC committee and management should pay close attention to the SPC data that are generated on the production floor. Doing so will give them an accurate picture of their production capability, the quality of their processes, the trends that may develop, and where they should concentrate resources for improvement. A secondary benefit of displaying this level of interest in SPC is that the operators and their support functions will know that management is truly interested in the program, and they will give it the attention and care appropriate to a high-visibility initiative.
Step 16: Eliminate the Root Causes of Any New Special Causes of Variation From time to time, new special causes will come up, even in processes that have long been in control. When this happens, the operator will know it because the SPC data will go out of limits or skew to one side or the other of the control chart centerline. It is important that the root causes of these special causes be eliminated to prevent their recurrence. For example, if the purchasing department placed an order for the next shipment of raw material from a different vendor because its price was cheaper than the current supplier, it is possible that the material coming from the new source might react differently in the process, shifting the process average one way or the other. The root cause may not be the new material. If you scrap it, purchasing is more than likely going to order the replacement material from the same low bidder, and the problem will probably recur. It would seem that the root cause of the problem is purchasing’s tendency to order from the cheapest source. Eliminating this root cause may require a management-approved procedure mandating the use of preferred suppliers. At the very least, there should be an ironclad agreement that purchasing will not order materials from a new supplier without having the material certified by quality assurance and manufacturing personnel. This is a case where the operator initiates the action, a team may identify the root cause, and management involvement may be required to eliminate the problem. This is the way the process is meant to proceed. Wherever the help must come from, it has to be readily available.
Process capability may be calculated in two ways. The first assumes that the process average is centered on the specification average and is denoted as Cp, the process capability index.

The second method is used when the process average is not assumed to be coincident with the specification average and is denoted as Cpk.

For either case, where the capability index
= 1 the specification limits and average are coincident with the process ±3s limits and process average.
< 1 the specification limits are tighter than the process spread. The defect rate will be greater than 3 parts per 1,000.
> 1 the process spread is tighter than the specification limits. The defect rate will be less than 3 parts per 1,000.
Note: 1.33 is the preferred minimum capability index.
Step 17: Narrow the Limits for Continual Improvement With the process under control and the special causes eliminated, continual improvement can be implemented. What this means is that the process average should be centered on the specification average, if that is not already the case and, more frequently, it means the narrowing of the ±3s limits (see Figure 18.23). Both of these improvements—centering the process on the specification average and narrowing the limits—will result in fewer parts
failing to meet the specifications. Scrappage will be reduced, the process will become more robust, quality will improve, and costs will decrease. The key, of course, is finding ways to improve the processes, but with SPC, one has the understanding of the processes necessary to see and comprehend the problems. Only then can real improvement follow.
Source: Goetsch David L., Davis Stanley B. (2016), Quality Management for organizational excellence introduction to total Quality, Pearson; 8th edition.
17 Jul 2021
17 Jul 2021
17 Jul 2021
16 Jul 2021
1 Jun 2021
17 Jul 2021