Although we have discussed various lengths of moving averages, up to this point our discussion has centered on the most basic type of moving average calculation—the SMA. Remember that each day’s calculation of the SMA represents adding the most recent day’s price figure and dropping the earliest day’s price figure. When calculating the simple moving average, equal weight is given to each daily observation. For a ten-day SMA, the information contained in the stock price for each of the ten days is given equal importance. However, in certain situations, the most recent stock price may have more bearing on the future direction of the stock than the ten-day old stock price does. If observations that are more recent contain more relevant information than earlier observations, we want to weight data in favor of the most recent observation. By calculating a weighted moving average, the most recent day’s information is weighted more heavily. This weighting scheme gives the most recent observation more importance in the moving average calculation.
1. The Linearly Weighted M oving Average (LWMA )
Let us refer back to the example in Table 14.1 to calculate a linearly weighted moving average. A ten-day linearly weighted moving average multiplies the tenth day observation by 10, the ninth day by 9, the eighth day by 8, and so forth. The total of these numbers is added up and divided by the sum of all the multipliers. In this case, the total will be divided by the sum 10 + 9 + 8 + 7 + 6 + 5 + 4 + 3 + 2 + 1, or 55. In Table 14.1, we find that the linearly weighted moving average for the first ten trading days is 85.78.
When using this ten-day moving average weighting scheme, the most recent trading data (Day 10) is given twice the importance of the price five days earlier (Day 5) and ten times the importance of the price ten days earlier (Day 1). As we go on to calculate the ten-day linearly weighted moving average for Day 11, the prices for trading Days 2-11 again will be weighted. Therefore, just as with the simple moving average, as the moving average is calculated for each successive day, the earliest trading day information is dropped from the data set being used in the calculation.
2. The Exponentially Smoothed Moving Average (EMA)
For some analysts, dropping off the earliest trading day’s data that occurs with an SMA or linearly weighted moving average is problematic. If the most recent price reflects little change, but the earliest price, now being omitted, shows considerable change, the moving average can be unduly influenced by the discarding of the older data. A large change in the moving average that results from the deletion of early data potentially generates a false signal. This is called the “drop-off effect” (Kaufman, 1998) and is probably the most criticized aspect of a simple moving average.
Although it is easy to see how this early data is not necessarily as important in determining future price movement as the most recent prices, it is still information that may have value. With both the simple moving average and the linearly weighted moving average, this older information, which lies outside the length of the moving average, is being totally ignored. To address this issue and maintain this older information in the moving average calculation, analysts use the exponential moving average (EMA).
To see how the exponential moving average is calculated, let us again refer to the example in Table 14.1. The simple ten-day moving average on Day 10 was 85.35. The closing price on Day 11 was 84.94, a lower value than the mean value for the previous ten days. To calculate the exponential moving average, we will use both the ten-day moving average (which represents the mean exchange rate for Days 1-10) and the closing price for Day 11. Thus, we are now using 11 days of price information. If we were going to calculate an SMA using these 11 days of information, each day’s price would have a weight of 1/11, or 9.09% in the calculation. Remember, however, that we want to place a larger weight on information that is more recent. If we want the price information from Day 11 to have a weight twice as great as it would have in a simple moving average, it would have a weight of 2/11, or 18.18%. Of course, the total of all the weights in the calculation of the exponential moving average must sum to 100%. This leaves 100% minus 18.18%, or 81.82% weight to be placed on the ten-day moving average.
The general formula for determining the weight of the current day’s data in the exponential moving average calculation is as follows:
![]()
In our example, the calculation gives us WEIGHTcurrent = 2 ÷ (10 + 1) = 18.18 percent. If we were using a longer moving average, this weight would decrease in value. For a 19-day EMA, the calculation would be 2 ÷ (19 + 1) or 10%; a 39-day EMA would have a weight of 2 ÷ (39 + 1), or 5%.
The general formula for determining the weight given to the moving average in the calculation of the exponential moving average is the following:
WEIGHTma = 100% – WEIGHTcurrent
In our example, we have WEIGHTma = 100% – 18.18% = 81.82%.
Once we have the weights, the formula for calculating the exponential moving average is as follows:
![]()
The exponential moving average for Day 11 in our example in Table 14.1 is calculated as the following:
EMA11 = .1818 x 84.94 + .8182 x 85.08 = 85.05
To calculate the exponential moving average for Day 12, we need only two pieces of information—the exponential moving average for Day 11 and the closing price for Day 12. The EMA12 would be calculated as follows:
EMA12 = .1818 x 84.76 + .8182 x 85.05 = 85.00
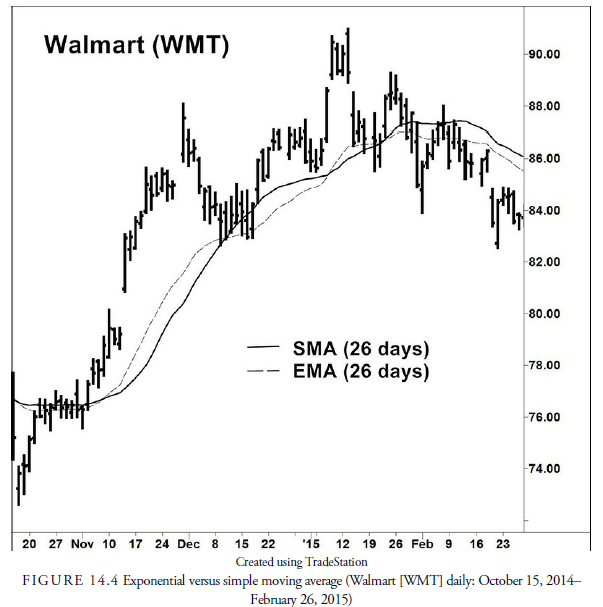
Figure 14.4 shows both a 26-day SMA and a 26-day EMA for WMT. Generally, the EMA will change direction more quickly because of the additional weighting that is placed on the most recent data. However, these two curves will usually track each other closely.
The EMA is used in a number of indicators and oscillators. In Chapter 8, “Measuring Market Strength,” for example, we looked at the McClellan Index. The McClellan Index uses a 19-day and a 39-day EMA. Because the 19-bar EMA has a smoothing factor of 0.10 and the 39-bar EMA has a smoothing factor of 0.05, these calculations are relatively easy. We will see later that a number of oscillators use an EMA, most prominently the MACD. The reason for the use of an EMA is that it is easily calculated and that it weighs more strongly the prices that are more recent. It is, thus, called an exponential weighted moving average.
3. Wilder Method
Welles Wilder (1978) used another simple method to calculate a moving average that weights the most recent number more heavily. The formula for calculating Wilder’s moving average is as follows:
![]()
For example, a 14-day Wilder moving average would be equal to the previous day’s moving average figure times 13 (that is, n – 1, where n is the number of items to be averaged) plus the current closing price, all divided by 14 (that is, n).
Wilder’s method of calculating a moving average should be used in the average true range (ATR), the relative strength index (RSI), and the directional movement indicator (DMI) calculations that he invented rather than the SMA or EMA. When using Wilder’s indicators that are prepackaged in available trading and charting software, one must be sure that the calculations for moving averages are Wilder’s. Some software programs use just an SMA or EMA and give results inconsistent with Wilder’s methods.
4. Geometric Moving Average (GMA)
The geometric moving average (GMA) is used mostly in indexes. It is a simple moving average of the percent changes between the previous bar and the current bar over some past predetermined period. Using percentages rather than points does not change its range or dimensions like a price-based moving average. However, it still has all the other problems of equal weight and lag.
5. Triangular Moving Average
Taking a moving average of a moving average gives a doubly smoothed moving average. The triangular moving average (TMA) begins with a simple moving average of a predetermined number of bars and then, using those results, takes a moving average of a length of half the original number of bars. An example would be a 20-day SMA of daily closes smoothed in a ten-day SMA. The result is a smoothed line that emphasizes the weight of the middle of the price series. The benefit of this method is that it doubly smoothes the data and, thus, better represents the trend. However, the double smoothing also detracts from its sensitivity to trend changes.
6. Variable EMAs
The use of a variable moving average is suggested by Chande and Kroll (1994). This moving average is the same as an exponential moving average (EMA), but the weighting scheme is adjusted based on the volatility of the price data. This is done to make the EMA shorter during trading ranges when volatility is narrow and expand the EMA when price begins to trend. The desire was to reduce the number of adverse signals during a trading range.
There are a number of variations of this theme. For example, the Kaufman adaptive moving average (KAMA) involves an extremely complicated formula that adjusts an EMA for volatility and trend (Kaufman, 1998). The volume-adjusted moving average (Arms, 1989) is a somewhat complicated moving average, but its essence is that it emphasizes those bars with higher volume. In the September 2001 issue of Stocks and Commodities Magazine, John Ehlers presents MAMA and FAMA. MAMA, the MESA adaptive moving average, and FAMA, the following adaptive moving average, are EMAs that adapt to volatility using Hilbert’s Transform based on the phase change of a cycle in the data. Needless to say, the calculation of these moving averages is complicated. A buy or sell signal is generated when the MAMA crosses the FAMA. In April 2004, Active Trader Magazine compared the effectiveness of using the MAMA-FAMA strategy to using an SMA for 18 stocks and found that the MAMA-FAMA strategy performed only slightly better than the simple method.
Source: Kirkpatrick II Charles D., Dahlquist Julie R. (2015), Technical Analysis: The Complete Resource for Financial Market Technicians, FT Press; 3rd edition.
I am glad to be a visitant of this consummate blog! , appreciate it for this rare information! .