When the stock market is rising, it is only reasonable to assume that individual stocks are making new highs. Conversely, stock market declines are associated with stocks making new lows.
Generally, a stock is considered to reach a new high if the day’s price is higher than the price has been over the past year. Prior to 1978, new highs and new lows were measured from January of the current year only, but in 1978, the New York Stock Exchange began determining new highs and new lows based on trailing 52- week prices. Other exchanges also adjusted their reporting at that time for consistency with the NYSE figures. Thus, a stock reaches a new high when the price is higher than it has been anytime during the previous 52 weeks, not necessarily when it has reached a new all-time high.
The financial press reports 52-week highs and lows, but the period of 52 weeks is not sacred. Analysts calculate many other periods based on their individual investment horizons. For short-term breakouts, for example, 10 or 21 days are used. In any case, the number of new highs and new lows is a useful measure of the number of stocks participating in an advance or decline. It is, thus, an indicator of a continuing trend and usually subject to divergence analysis, similar to breadth statistics.
The raw data of new highs and new lows is subject to the same problems as breadth in that the number of issues listed on an exchange will often change over time and make indicators using differences between highs and lows unreliable and subject to constant change in indicator parameters. As in breadth indicators, the way around this difficulty is to divide the difference between the new highs and lows by the total issues traded on the exchange, thus eliminating any bias from the changing number of listings.
1. New Highs Versus New Lows
The most straightforward, and probably useful, index is to buy when the number of new highs exceeds the number of new lows on a daily basis and to sell when the opposite occurs. Colby (2003) reports favorable results on both sides of the market, long or short, but the holding period is relatively short. One interesting aspect of net new weekly highs and lows is that they generally peak before the market peaks, similar to the breadth line. This extremely reliable observation can warn us when we see a negative divergence in weekly high- low data that a correction is due soon. (The average lead is 33 weeks with a wide error.)
Figure 8.13 shows Ned Davis Research, Inc.’s method of utilizing new highs and lows. It is a 55-day exponential moving average of the daily new highs divided by the sum of the new highs plus new lows. The buy signal is when the oscillator rises above 21%, and the sell signal is when the oscillator declines 40.5 points from the latest peak. The results show a 9.3% annual return versus a 6.6% return in the buy-and-hold.
2. High Low Logic Index
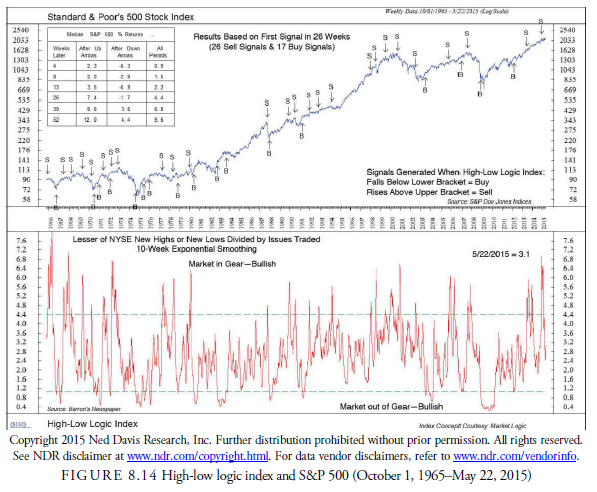
Norman Fosback (1976) is the developer of the high-low logic index. This index is defined as the lesser of two ratios: the number of weekly new highs to total issues or the number of weekly new lows to total issues. Low index levels tend to suggest a strongly trending market. A low number would indicate that either a low number of new highs or a low number of new lows is occurring. A high index level implies mixed market because the index can only be high when the number of both new highs and new lows is large.

Analysts traditionally smooth this index over ten weeks with a moving average (see Chapter 14). With either the raw or smoothed data, levels are then determined at which a signal is generated. Generally, high levels are bearish and low levels are bullish. In the first edition of The Encyclopedia of Technical Market Indicators, authors Robert Colby and Thomas Meyers (1988) reported that from 1937 to 1987, the results from such indicators were highly significant to the 99.9% confidence level. Their thresholds for raw data were above 0.020 for a down market one to three months later and below 0.002 for an up market one to six months later. For the ten-week smoothed index, a downward market was signaled above 0.058 for three months, and an upward market was signaled below 0.005 for three and twelve months later. Figure 8.14 shows Ned Davis Research, Inc. data and its thresholds for buying and selling. It is obvious that the buys are more reliable than the sells.
3. Hindenburg Omen
Many indicators use a combination of other indicators to derive a signal. The Hindenburg Omen described by Morris (2005) is such an indicator (see Figure 8.15). Similar to Fosback’s high-low logic index, the original indicator was devised by the late Jim Mikkea, former editor and publisher of the Sudbury Bull and Bear Report and was named by the late Kennedy Gammage (Colby, 2003) after the Hindenburg Dirigible disaster of 1937. Obviously, it signals a market reversal downward. The several descriptions of the current version are found at either (1) Morris (2005), (2) McClellan Financial Publications (http://www.mcoscillator.com), or (3) Robert McHugh (2014). The variables and parameters are individual but all produce approximately the same results: •
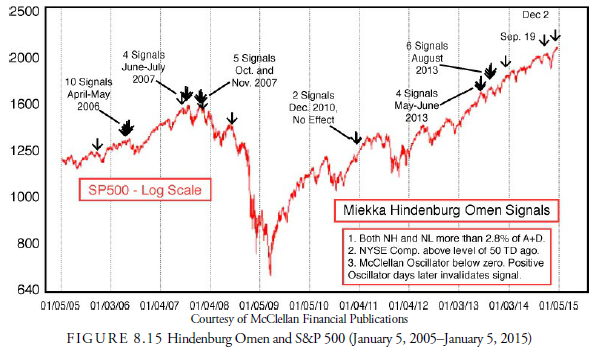
- The 52-week highs and lows are each greater than 2.2% (or 2.8%) of total issues.
- The small number of new highs or new lows is greater than 75.
- The NYSE index is higher than 50 day previous. An alternative condition is for the 10-week (50-day) moving average of the NYSE to be higher than ten weeks earlier.
- The McClellan Oscillator is negative.
- New highs cannot be more than two times the number of new lows
- Confirmation, defined as two or more occurrences within a 30–36-day period, exists.
The signal is valid for 30 to 36 days and active only when the McClellan Oscillator is negative. Strength of the signal is proportional to the number of early occurrences within the 30–36 day limit.
“The rationale behind the indicator is that, under normal conditions, either a substantial number of stocks establish new annual highs or a large number set new lows—but not both.” When both new highs and new lows are large, “it indicates the market is undergoing a period of extreme divergence—many stocks establishing new highs and many setting new lows as well. Such divergence is not usually conducive to future rising prices. A healthy market requires some semblance of internal uniformity, and it doesn’t matter what direction that uniformity takes. Many new highs and very few lows is obviously bullish, but so is a great many new lows accompanied by few or no new highs. This is the condition that leads to important market bottoms. ” (Peter Eliades, September 21, 2005, Daily Update, www. stockmarketcycles. com)
This indicator reportedly occurred prior to every major crash since 1985 (including the 1987 crash). Twenty-five confirmed omens have occurred, with only two failing to be followed by a decline of 2% or more. The other subsequent declines were not crashes because the omen often gives false signals for crashes. However, the odds of a crash (down more than 15%) are about 24% after a confirmed signal. One major problem with the derivation of this indicator is that it is so complex. As mentioned earlier, complexity usually comes from curve fitting and is, thus, potentially unreliable. The Hindenburg Omen, however, is based on technical logic and is certainly something to follow.
Source: Kirkpatrick II Charles D., Dahlquist Julie R. (2015), Technical Analysis: The Complete Resource for Financial Market Technicians, FT Press; 3rd edition.
You have brought up a very superb details , appreciate it for the post.