Let’s begin by looking at cycles occurring over a long period (over four years) of time. These cycles include Kondratieff waves, 34-year historical cycles, and decennial cycles.
1. Kondratieff Waves, or K-Waves
Nicolas D. Kondratieff, an economist who lived in Communist Russia, studied historical commodity prices in the 1920s. He analyzed European agricultural prices and copper prices from the late eighteenth century to his time and noticed a periodicity in these prices of approximately 50 years. He then hypothesized that there were long cycles in economic activity in capitalist nations that evolved and self-corrected and that the Marxist hopes for an approaching collapse of capitalism were misdirected. He was sent to a Siberian concentration camp, presumably for these views, where he died in 1938.
Few of Kondratieff’s papers were originally published in the West, but more recently, a large number have been collected and translated into a book, The Long Wave Cycle. The long 50-60-year cycle that he measured, known as the Kondratieff wave (or K-wave), is an economic phenomenon that is not necessarily observable in commodity or stock prices.
It was Harvard economics professor Joseph A. Schumpeter, endorsing Kondratieff’s ideas in the 1930s, who first used the name “Kondratieff wave” to refer to the cycle that Kondratieff uncovered. The K-wave theory remained in academic contention, largely because of the few-recorded instances, until the 1970s and 1980s, when the world economy slowed down and new research on the importance of innovation added substance to the theory of K-waves. Today there is a reasonable academic body of knowledge attached to K- wave theory. George Modelski and William Thompson have written extensively on the topic. In their book Leading Sectors and World Powers: The Coevolution of Global Economics and Politics, Modelski and Thompson point to the following important aspects of the K-wave theory:
- Waves are attributes of the world economy led by a major national economy.
- Waves concern output rather than prices—sector output surges rather than general macroeconomic performance.
- Waves unfold as phased processes, implying an S-shaped growth curve sequence rather than mechanical and precise periodic cycles.
- Waves arise from bunching of innovations in product, services, technology, methods of production, new markets, new sources of raw materials, and new forms of business organization (from Schumpeter). This innovation spurt comes from earlier economic slowdown, and its predominant innovative character (see Table 9.1) can identify each wave.
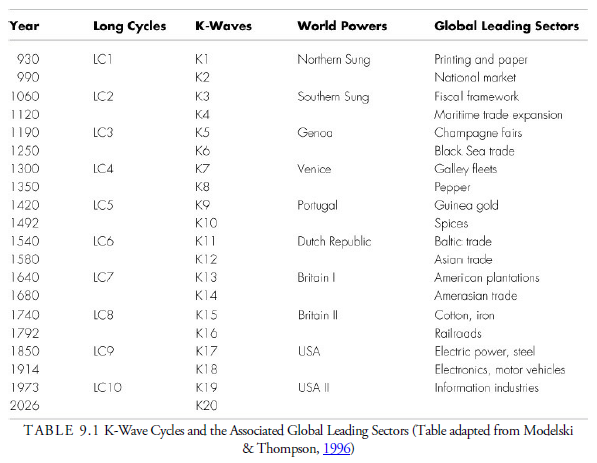
- Each K-wave has its characteristic location—cotton in Manchester, Great Britain, or technology in Orange County, California—and a clear location in time that can be dated. World systems theorists can now date the theory back 19 separate waves to Sung China, more than a thousand years ago.
- Each K-wave affects the structure of the world economy into the future.
- The long start-up of a K-wave is often accompanied by a major war.
- A significant relationship exists between the K-wave and the rise and fall of world powers. A new K-wave in a new and different location suggests the next location for global leadership. The Kwave grows out of necessity and innovation and then influences global power and politics as they evolve to accept the new economics.
The Kondratieff wave, therefore, is an interesting long-term phenomenon in economics and world politics, but it has only marginal use in the stock, bond, and commodities markets. In the 1970s, K-wave cycle theory increased in popularity as many people began watching what would happen as the fiftieth anniversary of the 1929 stock market crash and Great Depression approached. However, the rise out of the 1981–1982 stock market bottom—with the DJIA quickly breaking the 1,000 level, which continued until the year 2000— eliminated interest in the K-wave theory as applied to the stock market.
Because double K-waves seem to develop into even longer cycles of economic power and global leadership and the United States is in the second cycle, the prospects for U.S. markets are seemingly favorable for a third period of about 17 years after 2026, when the next wave is scheduled to begin. Of course, this period may, and likely will be, punctuated by wars and at least one economic depression, but the U.S. prospects are still relatively favorable, even if replaced by another innovative period somewhere else, with the K-wave cycle theory predicting at least a trading market for the next 50 years in the United States.
2. Population Waves
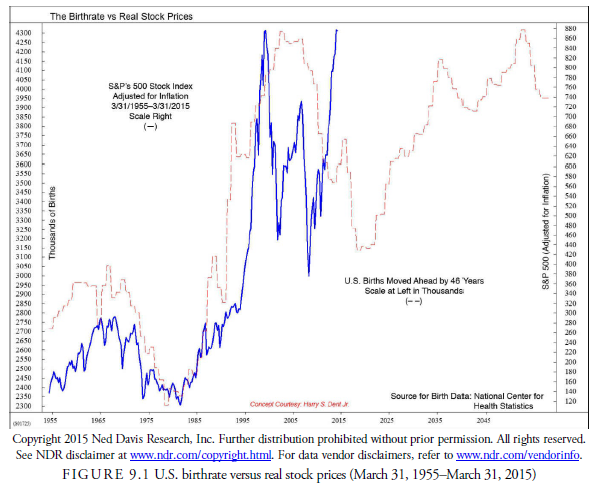
Confirming the prediction of the start of a new K-wave period beginning around the year 2026 is the relationship researchers have found between the U.S. birthrate and the stock market. A high correlation exists between the U.S. birthrate and U.S. stock market performance 46 years later. As seen in Figure 9.1, this correlation has been close since the mid-1950s. Should this relationship continue, the birthrate data projects a major stock market bottom around 2020 followed by another major, but slightly weaker rise than the 19802000 rise, into about the year 2050. The birthrate projection, of course, can change over the next 50 years and may even have started as seen in the past two years, but for now, it appears to confirm the projections of the K-wave.
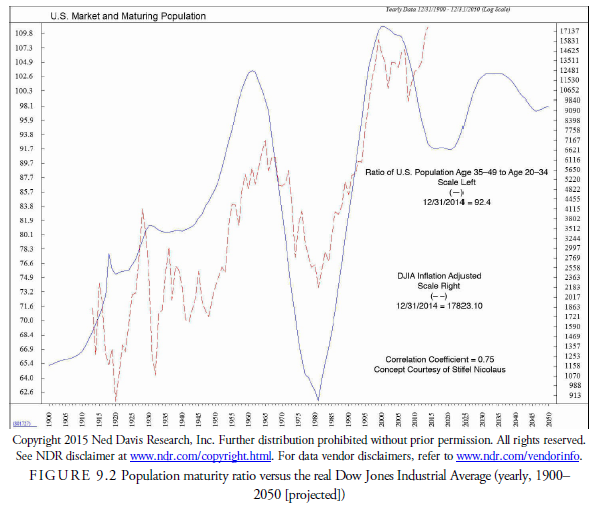
In addition to birthrates, the population age has a correlation to the long-term market cycle. Figure 9.2 shows the effect that a maturing population may have on the stock market over the next 20 years. It is the ratio of 35-49 year olds to 20-34 year olds. This measures the relationship between the young and the maturing and correlates well with the Dow Jones Industrial Average adjusted for inflation. The ratio is confirming the birthrate statistics, which point toward a bottom in the market somewhere around 2020, when it, too, has an expected low. The subsequent years after 2020 show another low around 2045 (the half-cycle of the Kondratieff cycle), which also appears in the birthrate statistics. If these hypothetical correlations turn out to be accurate, it appears that after the upcoming major correction, which could be nasty because it is also the end of a K-wave cycle, the stock market will advance for at least 20 years after the K-wave bottom.
3. 17—18-Year Alternating Stock Market Cycles
Historical data suggests that 35-year cycles, composed of a 17 1/2-year period of flat trend followed by a 17 1/2-year period of rising trend, also appear to exist. Figure 9.3, for example, shows a 17-year flat period with high volatility beginning in 1929 and ending in 1947. This was followed by a rising trend from 1947 through 1966. Then a flat market with volatility lasting until 1982 followed and in turn was followed by the granddaddy of all rising markets from 1982 to 2000. Since then the market has been in a flat range with increased volatility and is due to begin a new 17 H-year upward leg sometime around 2018. The end of this flat cycle would also be the end of the Kondratieff cycle due in the same period according to the population statistics.
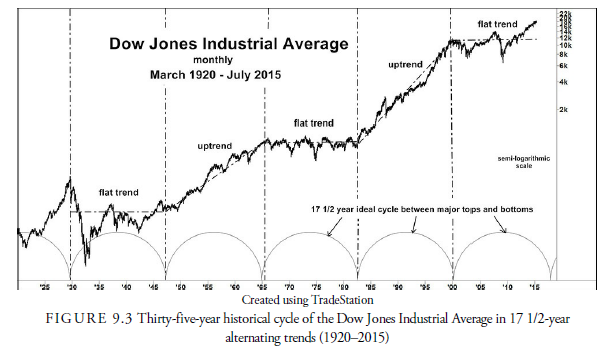
Notice that during the mid-1930s to mid-1940s, mid-1960s to the early 1980s, and since 2000 within the flat periods that volatility was very high. Declines of 35% and 50% occurred within these periods, as well as sharp advances, yet the overall, longer-term trends remained relatively flat. These are periods when technical analysts outshine fundamental analysts because the buy-and-hold philosophy breaks down. In the intensive periods between the mid-1940s and mid-1960s and early 1980s and early 2000s, the buy-and-hold investment philosophy returned as prices generally rose, and profits were made regardless of analytical method. Since the turn of the century in 2000, another dormant but volatile period has begun in which buy-and-hold strategies are failing and technical analysis is returning as the most successful analytic method.
Warren Buffett, one of the wealthiest men in the world, is not widely known to use technical methods; however, it is interesting to note that he has long used the 17-year cycle in his investment planning. Buffet does not attribute the cycle to growth in the GNP, noting that in the dormant cycle from the mid-1960s to the early 1980s, the GNP grew at twice the rate as during the intensive early 1980s to the turn of the century. Instead, he attributes the different periods to changes in interest rates, corporate profits, and investor confidence in the economy, ideas he learned from reading the book Common Stocks as Long-Term Investments by Edgar Lawrence Smith (1928), which he claims most influenced his investment philosophy (Loomis, 2001).
4. Decennial Pattern
In his book Tides and the Affairs of Men (1939), Edgar Lawrence Smith presented the notion of a ten- year stock market cycle (see Figure 9.4). Smith’s theory resulted from combining two other theories, Wesley Mitchell’s 40-month cycle theory and the theory of seasonality, both of which we cover in the shorter-term cycles later in this chapter. Combining these two periods, Smith theorized that there must be a ten-year, or 120-month, cycle. This would result from ten 12-month, annual cycles and three 40-month cycles coinciding every ten years.
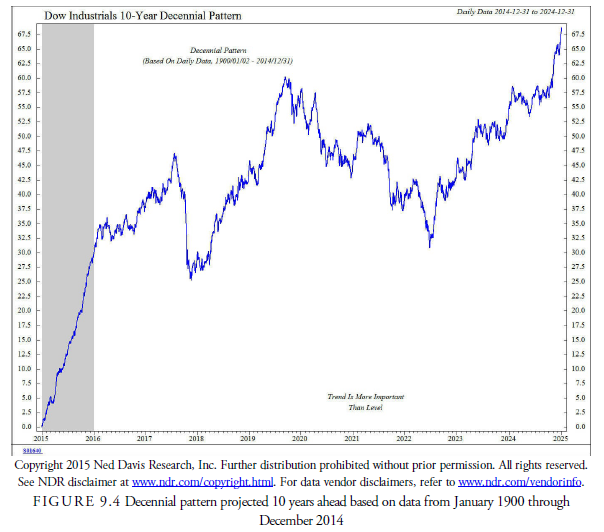
When Smith investigated prices more closely, he found that indeed there appeared to be a price pattern in the stock market that had similar characteristics every ten years. This pattern has since been called the decennial pattern.
The decennial pattern theory states that years ending in 3, 7, and 10 (and sometimes 6) are often down years. Years ending in 5, 8, and most of 9 are advancing years. Smith did not follow the normal calendar year beginning in January but found that counting the beginning of a year in October was more reliable. He also hypothesized that occasionally a 9-year or 11-year cycle overlaid the decennial cycle. He attempted to find the reason behind the decennial pattern and looked at sunspots and solar radiation, average rainfall, barometric pressure, and other weather-causing conditions, believing that weather patterns were the most likely cause of change in human psychology. It was then well accepted that weather had an effect on health and disease, and thus on optimism and pessimism, an observation first mentioned by Hippocrates.
The decennial pattern continues to have an excellent history. For example, the fifth-year advance has been observed for well over 100 years to never have failed 12 out of 12 times, although there is some question about whether 2005 advanced. Some market indexes were up slightly, and some were down. Most foreign stock markets advanced.
One problem with the theory is that a large enough sample is not possible yet, and such projections could be the result of chance. It is something to keep in the back of an investor’s mind but not something to use alone to commit funds to the stock market.
Source: Kirkpatrick II Charles D., Dahlquist Julie R. (2015), Technical Analysis: The Complete Resource for Financial Market Technicians, FT Press; 3rd edition.
I think this internet site has got very superb composed written content posts.