Price units are generally plotted on the vertical axis of stock charts. The analyst must determine the scale, or the distance between these price units, to use. Generally, two types of scales are used: an arithmetic scale and a semi-logarithmic scale.
Arithmetic Scale
For all the charts we have examined so far, along with most technical analysts, we have used arithmetic (or linear) scales. A plot with an arithmetic scale shows the price units along the vertical scale at the same price intervals. For example, the vertical plot distance of a change of $1 to $2 would be the same as the plot distance from 10 to 11 or 100 to 101. In other words, using regular evenly divided grid paper, we plot each box vertically as the same dollar amount.
2. Semi-Logarithmic Scale
Although the arithmetic scale is the scale most often used, sometimes adjustments need to be made, especially when observing long-term price movements. For example, compare Figure 11.10 with Figure 11.11.

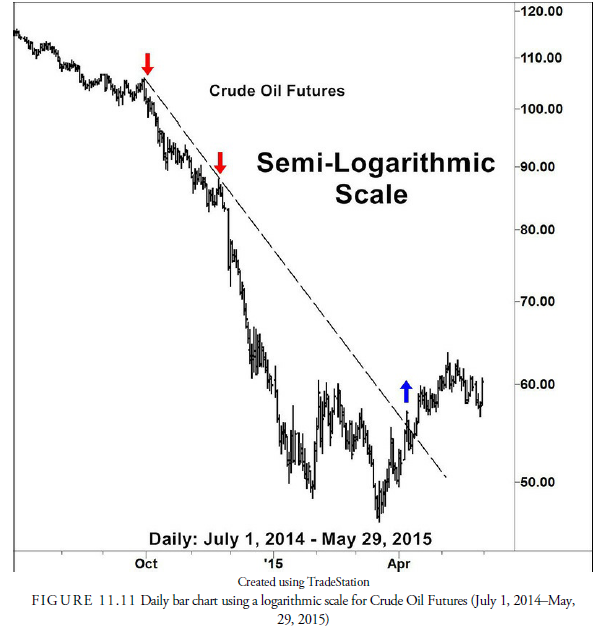
Both these charts plot the daily price of Crude Oil Futures for July 1, 2014 through May 29, 2015. In July 2014, crude oil was trading around $100 a barrel; at that time, a $10 increase in price would represent approximately a 10% gain for the investor. By January 2015, the crude oil price had declined to about $50 a barrel. At that point, a $10 price increase represented about a 20% gain for an investor owning crude oil. On the arithmetic scale, in Figure 11.10, a $10 price movement is visually the same whether it is a move from $50 to $60 or a move from $100 to $110. This type of scale can be somewhat deceptive; a $10 move is much more significant to an investor if the price of a security is $50 than if the price of the security is $100. The logarithmic scale addresses this issue.
On the logarithmic scale, the vertical distance represents the same percentage change in price. Look at Figure 11.11. In this logarithmically scaled graph, the vertical distance between $50 and $60 is larger than that between $100 and $110. This vertical distance between $100 and $110 always represents a 10% increase in price rather than a particular dollar amount increase in price. The rule of thumb for when to use an arithmetic or logarithmic scale is that when the security’s price range over the period being investigated is greater than 20%, a logarithmic scale is more accurate and useful. As a rule, the truly long-term charts (more than a few years) should always be plotted on logarithmic scales.
Another important difference in the two scales is how a trend line appears. In the arithmetic chart, the downward trend line touching the two down arrows arrives at the bottom of the chart in February and slices through the first rally in crude oil from its first bottom giving a false buy signal. In the semi-logarithmic chart, the trend line drawn from the same locations arrives at the bottom in April and gives a true signal. Regardless of the signals, the location of the trend line in the two types of scales is different and can affect the analysis of the prospects for crude oil.
Source: Kirkpatrick II Charles D., Dahlquist Julie R. (2015), Technical Analysis: The Complete Resource for Financial Market Technicians, FT Press; 3rd edition.
8 Jul 2021
8 Jul 2021
6 Jul 2021
7 Jul 2021
7 Jul 2021
7 Jul 2021