We have looked at a number of ways to calculate moving averages. Although each of these methods has its advantages and disadvantages, our main concern is not how to calculate a moving average but how to use moving averages to make money. Moving averages are widely used in the practice of technical analysis. They are a basic tool with a broad set of uses. Technical analysts use moving averages to determine trend, to determine levels of support and resistance, to spot price extremes, and for specific trading signals.
1. Determining Trend
Technical analysts use moving averages in four basic ways. First, moving averages are used as a measure of trend. The most common usage is comparing the current price with the moving average that represents the investor’s time horizon. For example, many investors use a 200-day moving average. If the stock or market average is above its 200-day moving average, the trend is considered upward. Conversely, if the stock or market average is below the 200-day moving average, the trend is considered downward.
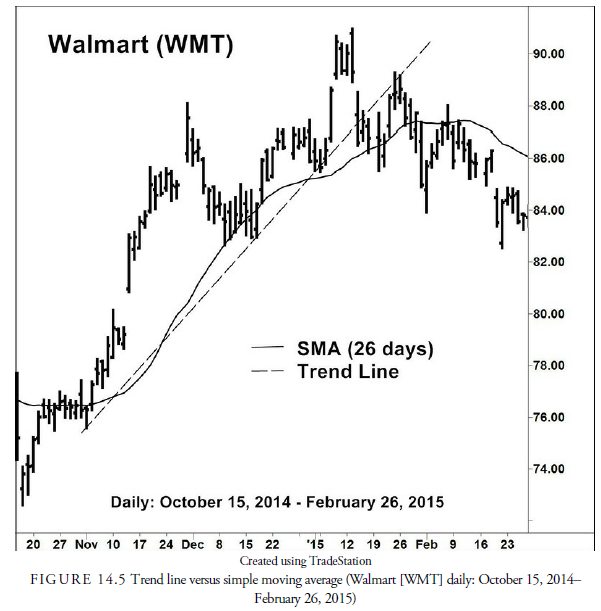
Figure 14.5 includes the same data with the moving average and the trend lines we used in Chapter 12, “Trends—The Basics.” You can see how the moving average tends to follow the trend line fairly well. The moving average then becomes a proxy for the trend line and can be used to determine when a trend is potentially changing direction, just as can a trend line. In the chart, for example, the later prices have held at both the trend line and the moving average.
2. Determining Support and Resistance
Second, the moving average often acts as support or resistance. As we have seen from Figure 14.5, a moving average often duplicates the trend line; therefore, it can be an easy trailing stop mechanism for determining when a position should be liquidated or reduced. In addition, prices seem to halt at the vicinity of moving averages. In Figure 14.5, for example, WMT halted its rally in late November at the moving average and again halted its decline at the moving average in early December.
3. Determining Price Extremes
Third, the moving average is an indicator of price extreme. Because the moving average is a mean, any reversion to the mean will tend to approach the moving average. For trading purposes, this reversion is sometimes profitable when the current price has deviated substantially from that mean or moving average. Price has a tendency to return to the mean. Thus, a deviation from the moving average is a measure of how much prices have risen or fallen ahead of their usual central tendency, and being likely to return to that mean, this deviation then becomes an opportunity to trade with and against the trend. As always, trading against the trend is dangerous and requires close stops, but the reversion also provides an opportunity to position with the trend when it occurs. In addition, when prices continue substantially away from the trend, they are often signaling that the trend is changing direction.
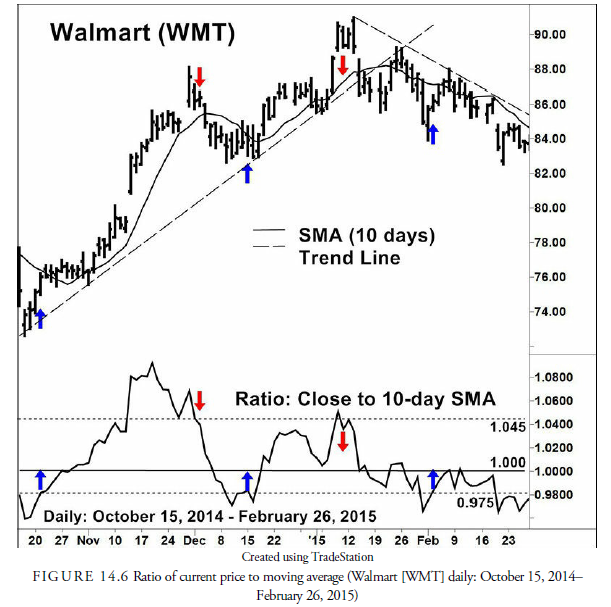
An example of the deviation about a 10-day SMA is shown in Figure 14.6. This is a ratio of the close to its 10-day moving average. It is a stock with a strong upward trend (the dominant trend for our purposes). When prices are trending strongly, they naturally will deviate from the moving average in the direction of the trend more than they will against it. In Figure 14.6, you can see that the advances carry much higher above the equilibrium level of 1.00 than they do during a correction in the upward trend. Action signal lines can thus be established, by testing, at the levels that optimize counter-trend signals. In Figure 14.6, we have arbitrarily used 1.0450 as the ratio below which we would sell WMT even in its upward trend and 0.9750 as the buy level above which we go long. Following this method, we go long on October 21 at 76.02 and sell at 86.40 on December 2. Again, we go long on the upward break of the ratio buy level on December 15 at 83.94 and sell at 89.35 on January 9. We have made nice profits by trading along the trend. The last buy signal comes on February 3 at 86.19. Notice, however, that the trend line has been broken and that the trend may now be going sideways or downward. We sold at the high but hesitate to buy on the signal because of the potential trend change. What else can go wrong? Sometimes the trend is so strong that the ratio never reaches below the buy level. A buy entry stop should thus be placed above the bar where the sale took place. In the last example on the chart, where the trend may have changed, the buy may not work, but if it has a sell stop at its signal bar low, a breaking of that low would indicate a trend change downward and the buy and sell levels in the ratio would be the reciprocals of the upward trend levels. Before you try this system, you should be sure to test for the optimal ratio levels under all trend directions including a flat trend. In this example, we did not optimize the levels; thus, they should not be used until tested.
4. Giving Specific Signals
Fourth, some technical analysts use moving averages to give specific signals. These can occur when prices cross a moving average, when a shorter moving average crosses a longer moving average, and in some cases, when a third, even shorter, moving average crosses two longer ones. Generally, using two moving averages and their crossover as a signal has been successful, but with substantial drawdowns in capital in sideways markets because of the many unprofitable small trades that occur from the many false signals. Methods, such as using the ADX, described in the next section, have been developed to determine if prices are trending at a rate at which a moving-average crossover system will work. The MAMA-FAMA system described previously and other methods of adapting moving averages to changes in volatility are aimed at solving this drawdown problem. However, it will not go away, and thus, although the crossover methods are profitable over time, the investor must have patience and enough capital to withstand a series of small losses until a trend develops.
Of the four strategies, the most sensible use of moving averages is trend determination. The trend is where the technical analyst profits. If the moving average can help in determining the trend, it is a useful tool. Indeed, it is only during a trending market that moving average signals are profitable. A sideways market is costly in almost all cases, but it’s especially so if the investor depends on moving average crossovers for signals. The deviation-from-trend method (see the section “Determining Price Extremes” above and Figure 14.6) is about the only moving average method that can profit in a flat trend. Once a directional trend has been established and identified, the next best method is to use price patterns and breakouts in the direction of the trend for timing of position entries. These methods will lag behind the major bottom and top of a price trend but will accrue profits and minimize losses while the trend is in effect. They are also the most popular method in professional trading systems, along with channel breakout systems such as Donchian’s four-week rule that we discuss in the “Channel” section of this chapter. Finally, other configurations of moving average, trend analysis will be found in Chapter 19, “Cycles,” where centered moving averages and forward lines are introduced.
Source: Kirkpatrick II Charles D., Dahlquist Julie R. (2015), Technical Analysis: The Complete Resource for Financial Market Technicians, FT Press; 3rd edition.
I real pleased to find this internet site on bing, just what I was searching for : D besides saved to my bookmarks.