Let us look at some of the short-term patterns and their trading implications. These are patterns in use today that by themselves are warnings, at best, but not necessarily action patterns, that should be followed without a cluster of other evidence. You will notice that none of the patterns includes moving averages. Over short time periods, especially when the period is interrupted by inactivity, moving averages are not reliable. For example, when using five-minute data, the only moving average with any value would be short because the period from one day to the next is interrupted by a long period overnight when no trading activity occurs. In 24-hour markets, short-term moving averages have more value because the markets are open continuously.
1. Gaps
Gaps occur when either the low for the current bar is above the high for the previous bar or the high for the current bar is lower than the low of the previous bar. Figure 17.1 pictures a gap down. The “hole” or “void” created in the price history is a “price range at which no shares changed hands” (Edwards and Magee, 2007). A price gap might or might not have significance. We have seen them before in analyzing breakouts from classic patterns, trend lines, and support or resistance zones, and in those instances, the gaps were demonstrating the beginning of a new trend. However, gap types differ based on the context in which they occur. Some are meaningful, and others can be disregarded.

Gaps often do not occur in market averages that are not themselves traded. For example, the day following Saddam Hussein’s capture on December 13, 2003, a majority of stocks opened strongly upward on gaps, while the Dow Jones Industrial Average showed an opening price roughly the same as that at the close of the previous day and then rose as the prices of the component stocks gradually opened. No gap existed in the DJIA because it is an average, not a security. On the other hand, the DJIA future showed a gap because it is a traded security.
2. Breakaway (or Breakout) Gaps
The most profitable gaps are those that occur at the beginning of a trend, called breakaway gaps. We have seen these before when prices suddenly break through a formation boundary and a major change in trend direction begins. Breakaway gaps signal that a pattern is completed and a boundary penetrated. The size of the gap—the space between the two extremes in which no activity occurs—appears to be proportional to the strength of the subsequent price move. Heavy volume usually accompanies upward gaps but not necessarily downward gaps. The best manner of trading breakaway gaps is to wait a short while for the initial fading or profit-taking by the professionals to see if the gap is filled and, if not, to enter in the direction of the gap with a stop at the point where the gap would be filled. If the gap is filled immediately, a stop and reverse might be appropriate because a sudden failure in a gap is often followed by a large move in the opposite direction from the gap direction, similar to a Specialist’s Breakout.
David Landry (2003) suggests a method of mechanizing the breakaway gap, known as the “explosion gap pivot.” A reversal point, often called a pivot, establishes not only where prices have reversed direction but also where supply and resistance are likely to occur in the future.1 In Landry’s method, a pivot low is the low of a bar that is surrounded on both sides by a bar with a higher low, as shown in Figure 17.2. This establishes a reversal point. Requirements that are more restrictive can be placed on the pivot point; for example, higher lows may be required for two or more bars on either side of the pivot point. For Landry’s method, however, one on both sides is sufficient.
- This reversal “pivot” should not be confused with the “pivot point” used in intraday trading for anticipating potential support and resistance levels.
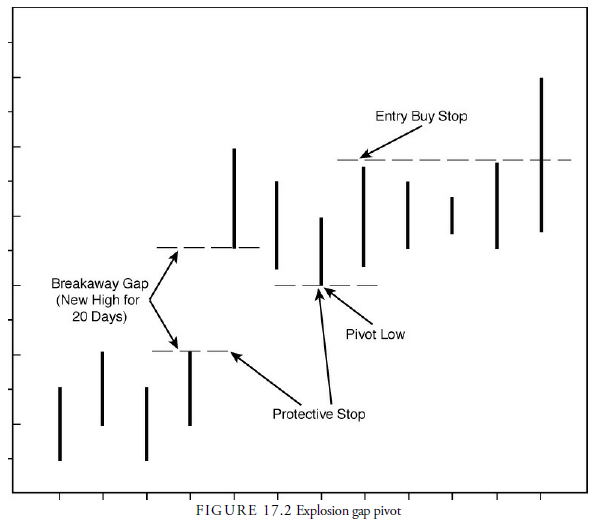
We know that a breakaway gap can be a false gap and that if it is “filled,” the odds of it being false increase. Thus, we want a breakaway gap to establish a new high, for at least the past 20 days, and for the subsequent retracement not to fill the gap. If either of these requirements is not met, the gap is ignored. When the retracement does occur, eventually it will create a pivot low above the lower edge of the gap. Once this pivot low occurs, a buy entry stop is placed above the high of the next bar from the pivot low (the one that establishes the pivot), and a protective stop is placed just above the gap lower edge (or Landry suggests just below the pivot low). If the gap is then filled, the protective stop will exit the position. Occasionally, the pivot low will be penetrated again, but as long as the gap is not filled, the position should be kept. The reverse configuration is equally applicable to downward breakaway gaps.
3. Opening Gap
When the opening price for the day is outside the range of the previous day, it is called an opening gap. After the opening, prices might continue in the direction of the gap, and the gap becomes a breakaway gap, or prices might retrace from the opening and fill the gap. Figure 17.3 shows an opening gap to the downside, with prices retracing and filling the gap during the day. This type of pattern is sometimes useful in determining a short-term trend reversal. The history of opening gaps in index futures suggests that they should be “faded” (or sold into) on large upward openings because they most often “fill” (retrace through the price vacuum) during the day. In downward opening gaps, a fill is not as common (Kaufman, 1998). In individual stock issues and commodities, a fill is a sign of weakness and should not occur in a breakaway gap. If the gap is not filled, usually within the first half hour, the odds of the trend continuing in the direction of the gap increase.

One potential way to profit from an opening gap is to watch the first three five-minute bars (a three-bar range) and determine the high and low of this range. A breakout of that range in the direction of the gap often indicates that the trend will continue in the gap direction; a breakout that moves in the direction of filling the gap will often continue to fill the gap. A danger is that the first run from the gap can last longer than the three bars. The three-bar range must, therefore, be obvious, not a continued run in the gap direction. In addition, the breakout from the three-bar gap range in the direction of the gap may be false. A tight stop is necessary, or a wait for a pullback or throwback from the breakout, a narrow range bar break, or even a small cup and handle.
If the price breaks the three-bar range in the other direction toward the fill, the previous day’s close, the fill line, will likely be the target. A bounce between the fill line and the range breakout line suggests that the longer-term move will be in the direction of the fill, a reversal of the gap. On the other hand, if the prices after a range break in the direction of the fill turn and retest the outer extreme of the three-bar range, the odds increase that the longer-term move will be in the direction of the gap.
4. Runaway Gaps (or Measuring Gaps)
Gaps that occur along a trend are called runaway gaps. They can appear in strong trends that have few minor corrections and just keep rising or declining without retracements or other interruptions. They are also called measuring gaps because, like pennants and flags, they often occur at about the middle of a price run, and, thus, the initial distance to them can be projected above them for a target price. An upward runaway gap occurs on average 43% of the distance from the trend beginning and the eventual peak, whereas a downward gap occurs on average 57% of the distance (Bulkowski, 2010).
5. Exhaustion Gaps
Exhaustion gaps occur at the end of moves but are not recognized at the time because they have the same characteristics as runaway gaps. If a gap is later closed, it is likely an exhaustion gap. These gaps appear when a strong trend has reached a point at which greed or fear has reached its apex. Usually they represent latecomers to the trend who are anxious to jump on or jump off. They can occur on light volume but more often occur on heavy volume.
The sign that such gaps are not runaway gaps is an immediate fill within a few bars of the gap. Remember that a runaway gap often occurs midstream in a price run. Prices should not immediately reverse and fill a gap unless the end of the run is approaching. Exhaustion gaps occur at the end of a move and signal a potential trend reversal. Usually more evidence of an exhaustion gap is necessary before an action signal can be justified. Sometimes prices reverse immediately, and sometimes they enter a congestion area.
6. Other Minor Gaps
Common gaps are those that occur frequently in illiquid trading vehicles, are small in relation to the price of the vehicle, or appear in short-term trading data. They are of no consequence. Pattern gaps occasionally appear within the formation of larger patterns, and generally they are filled. Their only significance is to suggest that a congestion area is forming. Ex-dividend gaps sometimes occur in stock prices when the dividend is paid and the stock price is adjusted the following day. These have no significance and must not be misinterpreted. Often gaps occur in 24-hour futures trading when one market closes and another opens, especially if one market is electronic and the other open outcry. These are called suspension gaps and are also meaningless unless they occur as one of the four principal gaps described previously.
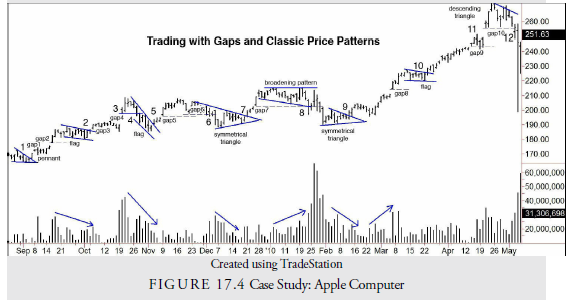
Box 17.1 Gaps and Classic Patterns—A Case Study of Apple Computer
Figure 17.4 contains daily bar charts for Apple Computer (AAPL) for September 2009 through May 2010. What actions might we have taken in this stock, given our knowledge of classic patterns and gaps? Each paragraph number that follows corresponds to a number on Figure 17.4.
-
- First we see a small pennant formation with an upward breakout at $167.28. We buy the stock on the breakout. Because we don’t have the past history, we can’t at this point make a measured move projection of the eventual target, and we decide to just hold the stock with a protective stop below the pennant’s lower bound at $164.11. Upward gap1 and gap2 appear next. We use them to place trailing stops as the price progresses upward. The pivot low after the gap1 is the first trailing stop at $169.70. We now have a locked-in profit even if the stop is triggered. Gap2 is a runaway gap. A runaway gap should not retrace back into the gap, or it is not a runaway. We, thus, raise the trailing stop to the upper edge of the gap at $177.88. Because this is a runaway gap, we can now project the target with the measured move method. We do this by measuring the price difference between the move beginning ($167.28) and the midpoint in the gap ($176.77). This $9.49 we add to the gap2 midpoint to arrive at an estimated objective of $176.77 + $9.49 = $186.26. This price is reached two days later, at which point we can sell or hang on with a close trailing stop so we don’t lose the gain we have already achieved. If we sell at the target price, we will have profited by $18.97, about 11.3% in nine days.
- The price then goes into a flag pattern, and when it breaks out at $187.30, we buy it again. This breakout is accompanied by gap3, which is later filled. We place the protective stop at the low price of the flag at $180.70.
- Gap4 occurs and has the initial appearance of a breakout or runaway gap. In neither case should prices fill such a gap, so we move our stop to the upper limit of gap4 at $197.85.
- Our trailing stop is triggered by an unexpected price decline that negates the earlier interpretation of gap4. We profit by $10.55.
- The price then forms a downward flag pattern, and volume confirms as it declines with price. The break upward from the flag triggers another buy at $190.73. This is followed by gap5, another likely runaway gap. The measured move projection from this gap is $200.73, which is reached on the day following gap5. We can sell at this level and reap another gain, this time of $10.00.
-
- Had we not sold at the target price, we still would have placed a trailing stop at the upper level of gap5 at $196.26 and sold the stock on the retracement. We might also have sold the stock short on the trailing stop because the filling of what’s thought to be a runaway gap is often an exhaustion gap and, therefore, a price trend reversal.
- Whether we sold the stock short or not, the upward breakout from a symmetrical triangle would require another entry buy at $196.05. Following that triangle, breakout gap7 forms. This also has the appearance of a runaway gap (strong price move closing near high on increased volume), and we move a trailing stop from below the triangle to the upper edge of the gap at $203.35. We also calculate the measured move target of $209.68, which is reached two days later. If we sell at the target, we achieve on the trade a profit of $13.63.
-
- If we don’t sell at the target, we certainly are forced to sell when the price breaks below our trailing stop at the upper bound of gap7. This breakout is not only through the gap but also through the lower bound of a broadening pattern. Indeed, with this combination, we will short the stock at the breakout price of $203.35 and place a protective stop at the upper bound of the broadening pattern at $215.55. Following the breakout down, the price rallies in a pullback to the breakdown level but fails to penetrate back through it on the upside. However, it also fails to continue downward after the pullback and instead forms a symmetrical triangle. We place a buy stop each day along the upper bound of the triangle as our trailing stop.
- We get stopped out with the trailing stop at $196.60, and we buy the stock on the basis of the triangle pattern confirmed with declining volume. We place a protective stop at the cradle of the triangle where the two bounds meet at $189.48 in case the breakout is false. Indeed, the price throws back shortly after the breakout but doesn’t penetrate the cradle, and we remain long the stock. Gap8 comes after a healthy rise in the stock price. This also has the appearance of a runaway gap (high volume, large price move), and we move our trailing stop to the upper bound of the gap at $219.70. The measured move target from this runaway gap is $234.02. It is reached 18 days later.
- We could sell at the target price, but before the target is reached, a flag pattern formed. We move our trailing stop up to the lower edge of the flag at $220.15 to protect our profit. A flag pattern is also a measured pattern that will give an additional price target. The calculation in this instance is to take the high point in the flag at $227.73 minus the starting price of the move ($196.60) for an estimated price distance of $31.13 that we add to the level at which the price breaks out of the flat ($224.64). But prices broke upward from the flag and, thus, projected $31.13 to a target of $255.77, our new target.
- Our price target is reached 21 trading days after the upward breakout from the flag pattern on a large upward gap (gap10). There was a small gap9 preceding gap10 and a few others along the way. Each of these gaps failed to show the characteristics of a runaway gap and were, thus, ignored. But gap10, aside from reaching our objective, was substantial and also likely a runaway gap, just because of the size of the gap compared with others. If we don’t sell at the target price, we at least move the trailing stop to the upper level of the gap at $255.73.
-
- As it turns out, gap10 was an exhaustion gap—something that can only be recognized in retrospect. However, we were stopped out of our trade at the trailing stop and perhaps went short on the exhaustion gap breakdown because this type of breakdown often indicates a trend reversal. That the exhaustion gap occurred at the price target from the earlier flag formation confirmed the likelihood of a trend reversal. The sell stop produced a profit of $59.13, a 30% gain, in less than 3 months.
The preceding example shows what can be done with just technical analysis alone. We did not act on any news or outside market behavior. We simply watched the price very closely. Stops were an important part of our strategy. If we had not moved stops when we did, we would have suffered at the upward breakout from the symmetrical triangle and from the failure of gap10. Risk control is sometimes more important than entry technique. Technical analysis takes knowledge, patience, and close watching of price action, but profits can be made.
6. Spike (or Wide-Range or Large-Range Bar)
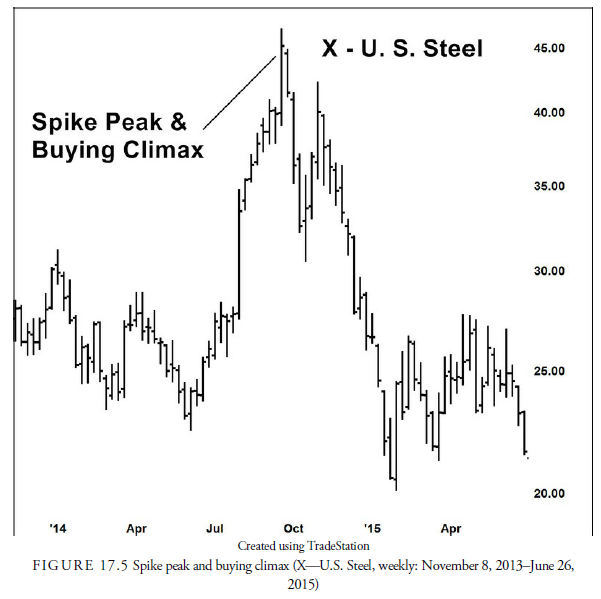
Spikes are similar to gaps except that the empty space associated with a gap is a solid line (in a bar chart). Should a breakaway gap occur intraday, for example, the daily bar would not show the discontinuity from the gap but instead would show a long bar. The importance of a spike, as in a gap, depends on the context surrounding it. A spike can occur on a breakout from a formation, midpoint in a strong, accelerating trend, and as the final reversal day at the end of a trend. In the earlier discussion of breakouts, we demonstrated the Specialist Breakout. This is often a spike because it usually occurs intraday. At the ends of trends when either gross enthusiasm or panic appears, the last few bars are often spikes. At the end of an accelerated trend, the last bar within the trend is often a spike called a climax (see Figure 17.5). Thus, spikes can represent the beginning or the end of a trend. On the other hand, some stocks and commodities, especially those awaiting a news announcement, will have wide-range bars that subside almost immediately within the next few days with little net change in trend direction. This behavior is generally associated with a stock or commodity that will not follow standard technical rules.
7. Dead Cat Bounce (DCB)
“Dead Cat Bounce” is a graceless term for a failed rally after a sharp decline. Although the term has been used for many years on Wall Street and in Chicago, it was probably first used in print either in a 1985 Financial Times article by reporter Chris Sherwell in a comment on the sharp decline in the Singapore stock market or by Raymond Devoe Jr., research analyst and professional cynic, who advocated using a bumper sticker “Beware the Dead Cat Bounce” in 1986.
The DCB is most profitable and more easily recognized after a large downward breakaway gap or downward breakaway spike. The sudden downward motion is called an event decline because it usually occurs on an event such as a bad news announcement. It lasts just a few days (average of seven) and usually begins a longer-term downward price trend. The DCB’s characteristics include a short rally of several days up to two weeks following the initial bottom from the sharp initial news event sell-off. Ideally, the rally should follow an event decline of more than 20%. Normally, the larger the first decline, the higher the bounce. A DCB is shown in Figure 17.6 of Hewlett Packard (HPQ). The “bounce” comes from bargain hunters and bottom-fishing traders who are second-guessing when the actual bottom will take place. It gathers momentum from short covering and momentum signals. The buyers are usually wrong. In more than 67% of DCBs (Bulkowski, 2010), the price continues to lower after the DCB and breaks the earlier news event low an average of 18%. The second decline in a DCB is characteristically less intense but equally deceiving. It also tends to be accompanied by much lower volume. Not all event declines include a DCB.

To trade the DCB, the event decline must first be recognized. This is usually easy because almost every day, somewhere, some bad news comes out about a company or commodity. Wait for the initial sell-off volume to decline and then look for a rally on lesser volume, sometimes back as far as the lower edge of the breakaway gap, and lasting only a few days. If the downward rush occurred as a spike rather than a gap, look into the intraday trading to see where the news event gap occurred, and use that gap just as if it had occurred between the daily bars. In the Hewlett Packard chart (refer to Figure 17.6), the rally filled the gap, just barely. The short-selling trading requirement then is for a topping of the bounce or a short-term top pattern, close protective stops above the entry, and a longer time horizon. For those wanting to purchase the stock, the odds are against profiting from a purchase for at least six months. Most bullish chart patterns fail during this period.
8. Island Reversal
An island reversal can occur at either a top or a bottom, and only after a relatively lengthy trend. It can happen in a congestion area, but only infrequently. It requires two gaps at roughly the same price: the first in the direction of the trend, an exhaustion gap, and the second in the reverse direction, a breakaway gap. The British Petroleum chart shown in Figure 17.6 shows an island reversal top within the context of a downward trend. The larger the gap, the more important is the formation. Between the gaps, low volatility trading can occur for a number of days or even weeks. Volume usually increases on the second gap from an island top but not necessarily from a bottom. The extreme price in the island must be either higher than previous highs at a top or lower than previous lows at a bottom. Pullbacks and throwbacks are frequent (65%—70%), and failures are low, around 13%—17%. This pattern is not common and has terrible performance results (Bulkowski, 2010).
9. One- and Two-Bar Reversal Patterns
The following one- and two-bar reversal patterns are common. Therefore, each of these patterns needs confirmation before use.
10. One-Bar Reversal (Also Reversal Bar, Climax, Top or Bottom Reversal Bar, Key Reversal Bar)
When a trading bar high is greater than the previous bar high and the close is down from the previous bar close, it is called a one-bar reversal. It is sometimes preceded by a gap, at least an opening gap, and its bar length is not as extreme or intensive as in a spike. It is not a spike, because a spike is not necessarily a reversal, but a combination of spike and reversal can elevate its meaning. This pattern will occur in reverse at a bottom. It is common, but unfortunately, its top and bottom version will also occur within a trend, making it practically useless as a signal by itself. To be useful, but also cutting down on the number of profitable signals, it needs more stringent requirements. For example, rather than just closing down, the close may be required to exceed the previous bar low or even the low of the two previous bars. Kamich (2003) argues that a close is more reliable after a sustained advance than after a short rally. This may require that it be the highest high or lowest low over a specified period or that a series of higher highs or lower lows precede it. When combined with a cluster of other evidence, a close’s significance improves. Whatever signal it gives is completely negated once prices exceed its reversal peak or trough.
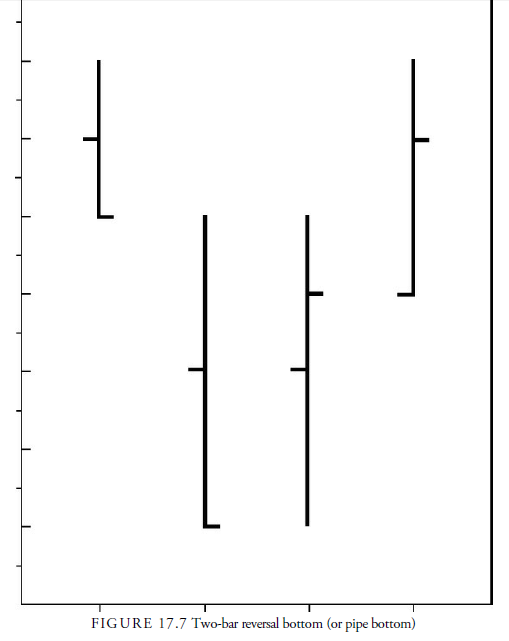
11. Two-Bar Reversal (Also Pipe Formation)
The two-bar reversal pattern, like the one-bar reversal, occurs at the end of a trend, upward or downward, but extends the reversal over two bars. Bulkowski calls it a pipe formation. A two-bar reversal formation is pictured in Figure 17.7. In the bottom pattern, the first bar usually closes in the lower half of the bar, and the second bar close ends near its high. Usually high volume is seen on both bars. In its extreme and more reliable version, it consists of two side-by-side spikes, but it can also be above-average length side-by-side bars of roughly equivalent length, peaking or bottoming at close to the same price, and occurring after a lengthy trend. Following and prior to the two-bar reversal, low bar prices should be in the vicinity of the top of the bars (in a bottom, the opposite for a top). It, thus, stands out quite easily in retrospect. It is preferable for the second bar to be slightly longer than the first bar, and volume is preferably higher on the left bar than on the right. Rarely this pattern acts as a consolidation area within a trend. Many pipes occur at the end of the retracement of a longer-term move. The directional clue is the direction of the breakout from it.
Failure rates are in the 5% range, which is low for a pattern (Bulkowski 2010). Usually the failure occurs when the previous trend has been less than 5%. If the earlier trend is lengthy, the pattern rarely fails. Once the pattern has formed and prices have reversed direction, it is common for a test of the bars to occur soon thereafter. In most cases, the bars hold their extreme within a small percentage during the test, and this presents a good spot to place an initial protective stop. Both Kamich and Bulkowski maintain that the formation in weekly bars is more reliable than in daily bars. Bulkowski ranks it 2 out of 23 for performance in a bull market.
12. Horn Pattern
Bulkowski describes the horn pattern as being almost identical in behavior to the pipe except a smaller bar separates the two lengthy bars. The two long bars become the “horns” of the formation (see Figure 17.8). As in the two-bar reversal, the formation is more reliable with weekly bars and otherwise has the same characteristics as the pipe. It is not as effective as the pipe at bottoms and tops, and its failure rate increases when the trend preceding the pattern is short.

13. Two-Bar Breakout
The two-bar breakout is an extremely simple pattern. Indeed, it is so simple that it is hard to believe it will work, but the testing column in Active Trader Magazine (November 2003) tested it and found it to be successful for stocks and commodities (more so with commodities). The rules they used and that could easily be experimented with are for longs: the next day buy on a stop one tick above today’s high if (1) today’s low is less than yesterday’s low, (2) today’s high is less than yesterday’s high, and (3) today’s close is less than today’s open. Exit on a stop at the then-current day’s low. The sell side is just the opposite. Results should be tested against a better exit strategy, but as it is, the pattern produced reasonable profits in commodities and an extremely low drawdown. In stocks, the results were not as favorable but likely could be improved upon with money management and a better exit strategy.
14. Inside Bar
An inside bar is a bar with a range that is smaller than and within the previous bar’s range, as shown in Figure 17.9. It reflects a decline in momentum in a trend, a bar where a short-term congestion area is formed. As in most congestion areas, it reflects a pause, a period of directionless equilibrium waiting for something to happen that will signal the next trend direction. During a larger congestion pattern, such as a triangle or rectangle, an inside bar has little meaning because it is just reflecting the lack of motion in the larger pattern. Some analysts plotting larger patterns delete inside bars, especially when determining pivots, because these bars fail to represent any important price action, similar to the way the point and figure chart eliminates dull periods. Within a trend, however, the inside bar provides some useful information and can generate profitable, short-term signals. As in the gap pattern, the context of the pattern’s location is more important than the pattern configuration.

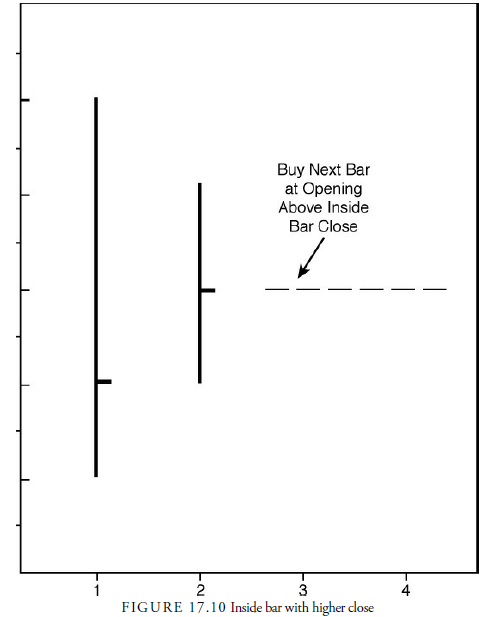
Toby Crabel (1989) found that without a cluster of other information, a number of inside bar combinations during the 1982-1986 period in the S&P futures achieved a better-than-average winning percentage. Crabel tested buying at the opening, if the opening price occurred above the earlier inside bar close, and selling at the opening, if it occurred below the earlier inside bar close (see Figure 17.10). This strategy produced a 68% winning percentage. This winning percentage could then be improved by adding even other requirements, mostly having to do with characteristics of the bars preceding the inside bar and with the preceding trend. One strategy, for example, is to buy if the inside bar close was higher than the previous day close and there is a higher open on the current bar. Likewise, you’d sell when the inside bar close was below the previous day close and the opening on the current bar is below the inside close. For this slightly more complex strategy, a 74% winning percentage occurred.
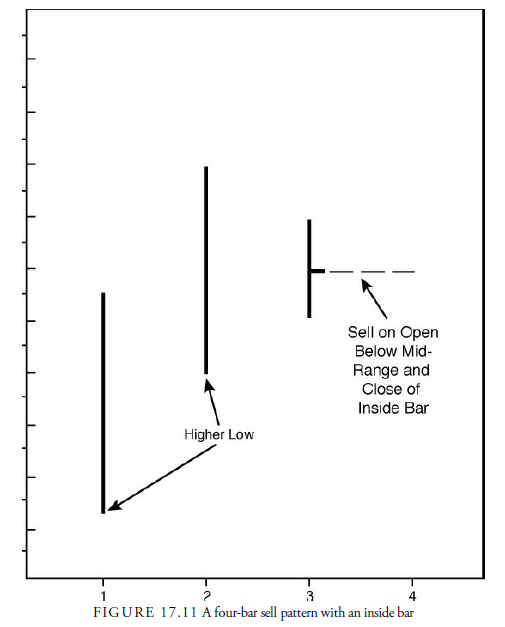
Crabel took his inside tests a little further, looking for a four-day pattern. If Day 2 had a higher low than Day 1, Day 3 was an inside day, and Day 4 opened lower than the midrange and close of the inside day, a sell signal was generated. This strategy is pictured in Figure 17.11. During Crabel’s test period, this strategy had an 80% winning percentage. The opposite strategy would occur when Day 2 had a lower high than Day 1, Day 3 was an inside day, and Day 4 opened above the inside day close, triggering a buy signal. This strategy produced a 90% winning percentage. Although these strategies had extremely high winning percentages, they only occurred on average twice a year.
What Crabel was demonstrating, regardless of the percentages, was that the opening of a bar after an inside bar shows a strong bias toward the new price direction. Granted, his testing was done during a bull market in the late 1980s and is somewhat dated today, but nevertheless, the tests showed some correlation to the inside day breakouts and future performance. His exit criterion was to close the position on the close of the day the trade was entered. This limits such trades to day traders. However, an inside bar can also occur on weekly bar charts and usually signifies a larger congestion area similar to a pennant or flag on a daily chart. In these cases, the inside week can be useful for longer-term trading.
Several other common patterns use the inside bar concept.
15. Hook Reversal Day
Hook is a common term for a quick loss when a profit was expected. It comes from the fishhook that the fish bites thinking that the bait is a free meal. As outlined by Kamich (2003) and Crabel (1989). a hook reversal occurs after a series of upward thrust bars, called run bars when they occur right after each other (Schwager. 1996). Then suddenly, a narrow-range bar occurs with specific characteristics. The narrow-range bar must open at above the previous high and close below the previous close. Kamich’s variation is for an inside bar that opens at its high and closes at its low. This signals that the momentum built up during the run has reached a climax. A downward break would be an action signal.
Another hook formation occurs when traders are “hooked” into believing that the trend has reversed. This occurs when an open is above the previous high, but prices reverse direction and close down on the bar. This is the hook. It must have a narrower range than the previous bar, but it often fools traders into believing that a top has occurred. The action signal is when the price breaks back above the close of the first. It also works in reverse.
16. Naked Bar Upward Reversal
A variation of the hook, a naked bar is one that closes below a previous low (suggested by Joe Stowell and Larry Williams) and is a down bar (close less than open). It is the most bearish close possible. If an inside bar follows a naked bar with open greater than naked bar close, it is a sign that the downtrend is reversing. An upward break from the inside bar would suggest the bears are caught.
17. Hikkake
The hikkake is an inside bar signal that fails and becomes a signal itself (see Figure 17.12). As described by Daniel Chesler (2004), in Japanese, “hikkake” is a term meaning to trap, trick, or ensnare. It is a pattern that starts with an inside bar. When prices break one way or the other from an inside bar, the conventional belief is that they will continue in the same direction. The hikkake pattern occurs when the breakout fails to continue and prices in the following bars return to break in the opposite direction through the previous inside bar extreme. The reversal and opposite breakout must occur within three bars after the first breakout; the open and close of each bar seems to be unimportant.

18. Outside Bar
An outside bar occurs when the high is higher than the high of the previous bar and the low is lower than the low of the previous bar. It is a specific kind of wide-range bar that “covers” all the previous bar’s price action. In other words, the outside bar is longer than the previous bar and contains the entire price range of the previous bar. Traditionally, an outside bar is thought of as a bar of increased volatility, and, depending on the close, perhaps the beginning of a trend. Larry Williams (1988, 1995, 1999, 2000, and 2003) has done considerable study of outside bars, and the results are available in his various books.
When an outside bar closes near an extreme—that is, a high or low—and above or below the previous close and its current opening, it suggests further action in the direction of the close into the following bar. Bulkowski, using daily lows, observes that the close, if located within the upper or lower 25% of the range, tends to predict the future breakout upward about 66% of the time and downward 62% of the time. However, it often is a false signal. For example, one of the more reliable, although less frequently seen, setup patterns with an outside day is when the outside day closes at below the previous day’s low and the next day opens lower than the outside day close. Buy the following day opening (Williams, 2000). Standard opinion would suggest that the series of lower closes was bearish, yet the setup is bullish.
19. Other Multiple-Bar Patterns
One- or two-day patterns are common, easily defined but not always reliable. Complex patterns are subject to interpretation by the analyst because their formation is not a perfect fit to the ideal. Between these pattern types are patterns with a few bars that have simple rules but require more price action than the short-term variety and are not as common as classic patterns.
20. Correction within a Trend
Many studies have shown that acting in the direction of the trend is more advantageous after waiting for a correction to that trend. The reward of catching the trend at a cheaper price as well as having a closer stop level outweigh the potential opportunity loss of missing the trend.
There are at least two different types of trend correction patterns. One is to recognize a trend and act on a percentage pullback from that trend. Active Trader Magazine (March, 2003) tested on 18 stocks a long- only 6% pullback system. It demonstrated during the period 1992 through 2002, a generally rising period, that entering a buy at 6% below the previous bar close and exiting on the next open would produce an excellent equity curve when triggered. The gain over the period was the same as the buy-and-hold, but the market exposure was only 17% due to the limited number of trades and the quick exits.
21. Knockout Pattern
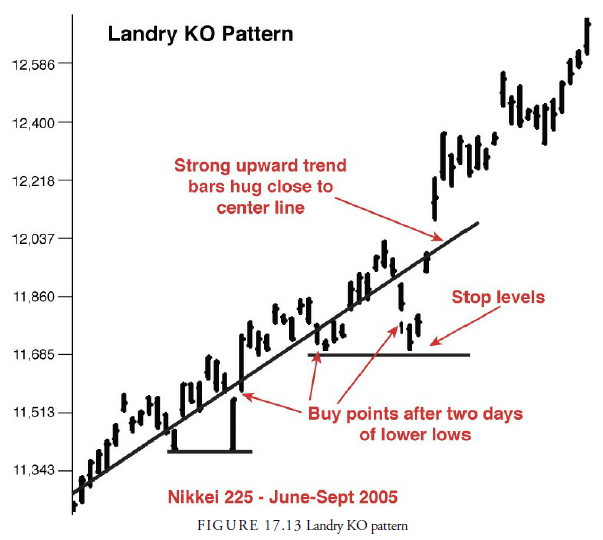
The knockout (or KO) pattern is another trend correction method, used by David Landry (2003). (See Figure 17.13.) The first requirement for this pattern is that an extremely strong and persistent trend must be present. In an upward trend, Landry’s criteria for a strong uptrend is that the stock must have risen at least ten points in the past 20 trading days and a trend line drawn through the prices touch almost all bars. Thus, if we think about a linear regression line, the bars should have a small deviation from that line, not wide swings back and forth. At some time, the stock will develop a throwback of two to five days in which two prior lows will be exceeded. Place a buy entry stop at the high of the bar with the second low. If the next bar is lower, move the buy stop to its high until the position is executed. Place a protective stop below the last low, or use any reasonable stop method. According to Landry, the reverse is equally as successful in a downtrend using the criteria in reverse. Figure 17.13 shows a steady downward trend in the Nikkei 225 with occasional two-day rallies that fulfill the requirements of the KO pattern.
22. Oops!
Larry Williams (1979) uses the term Oops! to name an opening range pattern that profits from a sudden change in direction (see Figure 17.14). The setup for this pattern occurs when the opening price on today’s bar is outside the previous day’s range. Assume, for example, that a stock opens today at a price below yesterday’s range. A buy stop is then placed just inside yesterday’s range in case the market closes the gap, indicating a reversal. This pattern depends on other traders acting in the direction of an opening gap and being caught when prices reverse.

Larry Connors (1998) uses a 10% qualification variation of the Larry Williams Oops! pattern. The pattern is for the first day to have a close within 10% of the low. The second day must open on a downward gap. If these conditions are met, place a buy stop at the first day’s low with a sell stop near the second day’s opening.
A sell pattern is just the reverse on a day when the close is within 10% of its high.
23. Shark
The shark pattern is a three-bar pattern. The most recent bar high must be lower than the previous high and the recent low above the previous low. In other words, the recent bar is an inside bar. The previous bar must also be an inside bar. The progression in bars, therefore, is one base bar and two successive inside bars, as shown in Figure 17.15. In effect, it is a small triangle or pennant. The name “shark” comes from the pattern’s finlike shape.

In a Stocks and Commodities article, Walter Downs (1998) demonstrated that the short-term pattern called the Shark-32 has implications for the longer-term as well as the immediate future. This study was an interesting approach to determining the success or failure of the pattern in that Downs questioned whether the symmetry of the pattern added to or detracted from its performance. Symmetry was measured by determining the amount by which the center of the final inside day range, called the apex, deviated from the center of the base day range. Although there can be many shark patterns, Downs limited his study to those patterns that fit a specified symmetry. The test was run on Harley Davidson stock from July 1986 to April 1998, a period of generally rising stock prices. The entry was to buy on the close of the first day after a day in which the close exceeded the widest point in the pattern—usually the base day. The exit was a trailing stop or a reversal on the opposite signal.
The results of Downs’ study were useful in that they suggested that the more symmetrical the shark formation, the more likely prices would continue in the same direction and improve performance at least out to 30 days thereafter. As the symmetry became tight, the results did not change, but the number of patterns that fit into the requirements declined. One example was that if the symmetrical variance of the apex midrange was within 12% either side of the center of the base day range, the trend continued in the same direction as the prepattern direction 91% of the time, strengthened in 36% of the instances, and increased in momentum 34% of the time within 30 days.
24. Volatility Patterns
Most short-term patterns rely on an expansion in volatility. The inside bar strategies, for example, are based on the notion that inside bars represent low volatility and that when prices break one way or another, volatility expands. To take this concept of volatility further, many patterns look directly at volatility itself—either historical volatility as defined in the option markets, changes in trading ranges, or indicators such as the ADX. An expansion in volatility is used as a signal for action in most patterns, but sometimes a contrary action is suggested when volatility becomes extreme. Following are examples of some of these patterns.
25. Wide-Range Bar
A wide-range bar is a bar in which the range is “considerably” wider than the normal bar. The bars are relatively long compared with the previous bar. How large does the range have to be to be considered “wide,” and how far back must the comparison be made? There are no definitive answers to these questions. In any case, a wide-range bar is usually a bar with increased volatility. Increased volatility can imply the beginning of a new trend as in a breakout bar, or if the trend has been in existence for a long time and is accelerating, the wide-range bar may act like an exhaustion gap and warn of the trend’s end. As a sign of impending trend reversal, it is more often seen at panic lows, as the emotions of fear accelerate prices downward. Emotional spikes and two-bar reversals are often wide-range bars. Otherwise, it is usually found on a breakout from a pattern, small or large, or as the base for a pennant or flag, indicating that the trend reached a very short-term peak and is about to consolidate. On the other hand, not all wide-range bars are meaningful. Consideration of trend, areas of support and resistance, patterns, and the relative location of opens and closes are necessary before a judgment of the significance of the wide-range bar can be determined.
Larry Connors (1998) gives an example of a wide-range pattern. Connors first looks for a wide-range day in which a stock experiences a two-standard deviation decline. On the following day, if the opening is a downward gap, place a buy entry stop at the first day’s close with a protection stop at the first day’s low. If the buy is near the previous day’s low, lower the stop to give some room for the pattern to develop. The reverse set of signals is valid on the sell side at a top. The exit is to sell on the close, or if the close on the action day is within 10% to 15% of the high, sell on the next day opening.
26. Narrow-Range Bar (NR)
Wide-range bars indicate high volatility; narrow-range bars indicate low volatility (see Figure 17.16). Determining narrow-range bars is useful because the low volatility will eventually switch to high volatility. As with the wide-range bar, the criteria for determining a narrow-range bar are not precise.

Toby Crabel designed one method of defining and using narrow-range days. In his method, he determines whether the current day has a narrower range than the previous day and, if so, over how many past days. For example, if the current day has a narrower range than the past three days, it is called an NR4 day (to include the current day and the past three days); in other words, the current day represents the narrowest trading range of the four days. The common narrow days of this type are the NR4 and NR7 day. Their entry signal is a breakout from the most recent narrow-range day. Thus, if today is an NR7 day, we place a buy and sell entry stop on either side to be acted upon tomorrow or the next day.
Linda Bradford Raschke (www.lbrgroup.com) is one of the leading proponents of using narrow-range days to determine low-volatility setups. Raschke adds another constraint to Crabel’s method. She calculates the historic volatility of the vehicle over 6 days and over 100 days. If the 6-day historic volatility is 50% less than the 100-day, the conditions are right for either an NR4 day or inside day signal, provided today meets the criteria for each of these types of days. The buy and sell entry stops are placed at the high and low of the qualified NR4 or inside day. If the entry stop is executed, an additional exit stop is placed where the opposite entry stop currently exists. Exit the position at the close of the day if not already stopped out.
27. VIX
In our discussion of sentiment indicators in Chapter 7, “Sentiment,” we introduced the VIX, a measure of implied volatility in the S&P 500 options. Remember that the VIX is a reflection of anxiousness in the market. Traders and investors become anxious when the market declines and become complacent when the market advances. Thus, VIX becomes a sentiment indicator. Generally, when the market is bottoming, VIX is high because of the investor anxiousness. When the market is topping, VIX is generally low, indicating the complacency among investors.
Larry Connors (1998) introduced a number of short-term price patterns that were based on the behavior of the VIX. The principle behind these patterns was to watch for changes in VIX, as a measure of sentiment, at extremes, as for example, either after X number of days or combining with an oscillator formula to determine when VIX is overbought or oversold. A more general strategy for the VIX was to look at the deviation from a moving average (Connors, 2004). VIX has changed levels over the past decade, but a moving average dampens those changes. Connors used a 5% deviation from a 10-day simple moving average. If the VIX is below the SMA by 5% and the market is above its 200-day moving average, the odds favor a continuing upward trend but not necessarily a good time to buy except on throwbacks. When the ratio is above 5%, and even more so when it is above 10% of the SMA, the time is usually excellent to buy. Thus, the VIX in this instance gives general zones of when action in certain directions can be contemplated. The opposite relationship is valid when the market is below its 200-day moving average. Generally, bottoms are more reliably signaled by the VIX than tops.
28. Intraday Patterns
The opening range is the range of a daily bar that forms in the first few minutes or hour of the trading day (see Figure 17.17). It can be defined as either the high and low after a certain time, such as the high and low price that occur during the first 15 minutes of trading, or it can be a predetermined range about the opening price. A horizontal line is drawn at the opening range high and low on the intraday bar chart as a reference for the rest of the day. Other lines from the opening price, the close yesterday, the range yesterday, and so forth may also be drawn. These lines often become support or resistance levels during the day.

The opening range breakout (ORB) is a popular method of entering a position once a setup has been established from a previous short-term pattern. As reported in Stocks & Commodities Magazine, Toby Crabel experimented with NR days as setups and used an ORB defined by a specified, predetermined amount above or below the opening range. He compared these results with using a wide-range day setup. He found, first, that the wide-range day setup over both four and seven days vastly underperformed the NR days over the same period, thus confirming that more profit can be obtained from an expansion in volatility than contraction. Second, he found that once the price had moved away from the open in one direction after an NR2, it normally did not return to the opening.
In a series of articles for Stocks & Commodities Magazine, Crabel describes methods of trading from an ORB in considerable detail. In the first article, he described how he calculates the specified amount, called the stretch, above and below the opening that establishes the ORB. Crabel uses the ten-day average of the past differences between the open for each day and its closest extreme to the open for that day. Analysts use a number of other methods for calculating stretch, including specifying a number of ticks or calculating a range based on the ATR over some past period.
Crabel found that the use of ORBs worked well with NR4, NR7, inside days, and hook days. He found that the earlier in the day the ORB was penetrated, the better the chance for success. Even without the previously mentioned setups, trading on the ORB within the first five to ten minutes would also work, but after that short interval, if the prices have not penetrated out of the range, all orders should be canceled because the day will likely revert to a listless trading day rather than a trending day.
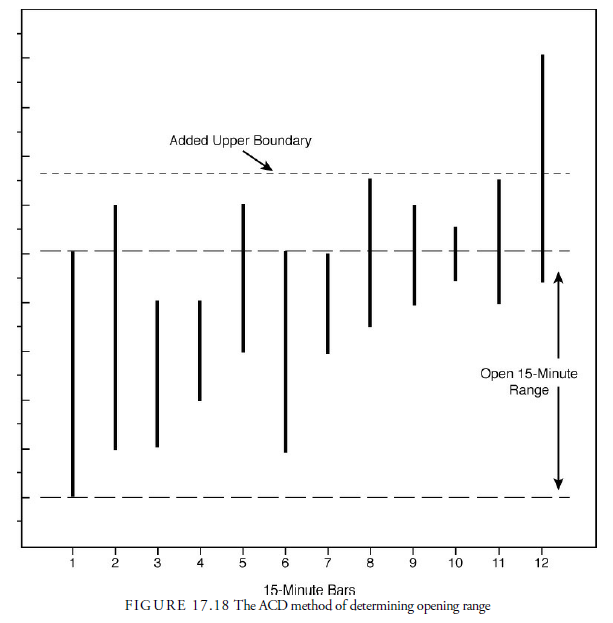
By analyzing the action around opening range levels, a good trader can find ways to take advantage of the tendency for these levels to act as support and resistance. One method of accomplishing this is called the ACD method, developed by Mark Fisher (2002). This somewhat complicated method uses the opening range determined over the initial minutes of trading, an additional filter that is added to the upper bound of the range, and another subtracted from the lower edge, as shown in Figure 17.18. Entry signals occur when the outer bounds are broken during the day, and exit signals occur when the range bounds are broken. Fisher’s method is not quite this simple because he uses numerous other rules and confirmations. However, Fisher, who reportedly has a trading room of more than 75 day traders using this method to make their daily bread, has appeared to be very successful.
Source: Kirkpatrick II Charles D., Dahlquist Julie R. (2015), Technical Analysis: The Complete Resource for Financial Market Technicians, FT Press; 3rd edition.
7 Jul 2021
7 Jul 2021
7 Jul 2021
6 Jul 2021
7 Jul 2021
7 Jul 2021