1. DESIGN OF PRODUCT LAYOUT
In product layout, equipment or departments are dedicated to a particular product line, duplicate equipment is employed to avoid backtracking, and a straight-line flow of material movement is achievable. Adopting a product layout makes sense when the batch size of a given product or part is large relative to the number of different products or parts produced.
Assembly lines are a special case of product layout. In a general sense, the term assembly line refers to progressive assembly linked by some material-handling device. The usual assumption is that some form of pacing is present and the allowable processing time is equivalent for all workstations. Within this broad definition, there are important differences among line types. A few of these are material handling devices (belt or roller conveyor, overhead crane); line configuration (U-shape, straight, branching); pacing (mechanical, human); product mix (one product or multiple products); workstation characteristics (workers may sit, stand, walk with the line, or ride the line); and length of the line (few or many workers). The range of products partially or completely assembled on lines includes toys, appliances, autos, clothing and a wide variety of electronic components. In fact, virtually any product that has multiple parts and is produced in large volume uses assembly lines to some degree.
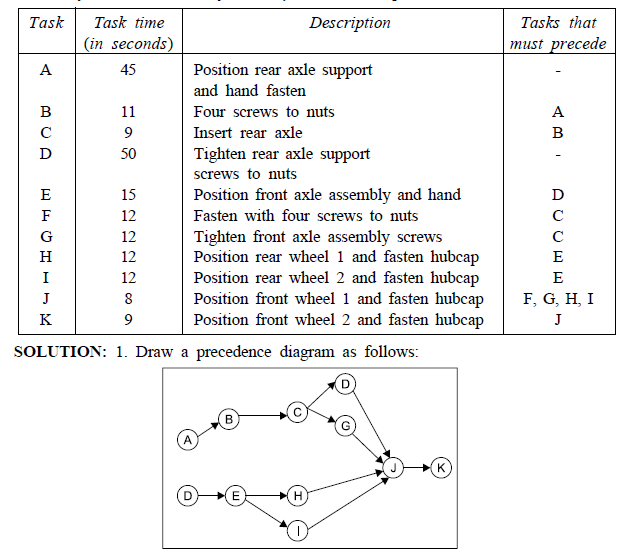
A more-challenging problem is the determination of the optimum configuration of operators and buffers in a production flow process. A major design consideration in production lines is the assignment of operation so that all stages are more or less equally loaded. Consider the case of traditional assembly lines illustrated in Fig. 2.10.

In this example, parts move along a conveyor at a rate of one part per minute to three groups of workstations. The first operation requires 3 minutes per unit; the second operation requires 1 minute per unit; and the third requires 2 minutes per unit. The first workstation consists of three operators; the second, one operator; and the third, two operators. An operator removes a part from the conveyor and performs some assembly task at his or her workstation. The completed part is returned to the conveyor and transported to the next operation. The number of operators at each workstation was chosen so that the line is balanced. Since three operators work simultaneously at the first workstation, on the average one part will be completed each
minute. This is also true for other two stations. Since the parts arrive at a rate of one per minute, parts are also completed at this rate.
Assembly-line systems work well when there is a low variance in the times required to perform the individual subassemblies. If the tasks are somewhat complex, thus resulting in a higher assembly-time variance, operators down the line may not be able to keep up with the flow of parts from the preceding workstation or may experience excessive idle time. An alternative to a conveyor-paced assembly-line is a sequence of workstations linked by gravity conveyors, which act as buffers between successive operations.
1.1. Line Balancing
Assembly-line balancing often has implications for layout. This would occur when, for balance purposes, workstation size or the number used would have to be physically modified.
The most common assembly-line is a moving conveyor that passes a series of workstations in a uniform time interval called the workstation cycle time (which is also the time between successive units coming off the end of the line). At each workstation, work is performed on a product either by adding parts or by completing assembly operations. The work performed at each station is made up of many bits of work, termed tasks, elements, and work units. Such tasks are described by motion-time analysis. Generally, they are grouping that cannot be subdivided on the assembly-line without paying a penalty in extra motions.
The total work to be performed at a workstation is equal to the sum of the tasks assigned to that workstation. The line-balancing problem is one of assigning all tasks to a series of workstations so that each workstation has no more than can be done in the workstation cycle time, and so that the unassigned (idle) time across all workstations is minimized.
The problem is complicated by the relationships among tasks imposed by product design and process technologies. This is called the precedence relationship, which specifies the order in which tasks must be performed in the assembly process.
The steps in balancing an assembly line are:
- Specify the sequential relationships among tasks using a precedence diagram.
- Determine the required workstation cycle time C, using the formula

- Determine the theoretical minimum number of workstations (Nf) required to satisfy the workstation cycle time constraint using the formula

- Select a primary rule by which tasks are to be assigned to workstations, and a secondary rule to break ties.
- Assign tasks, one at a time, to the first workstation until the sum of the task times is equal to the workstation cycle time, or no other tasks are feasible because of time or sequence restrictions. Repeat the process for workstation 2, workstation 3, and so on until all tasks are assigned.
- Evaluate the efficiency of the balance derived using the formula
- If efficiency is unsatisfactory, rebalance using a different decision rule.


ILLUSTRATION 7: The MS 800 car is to be assembled on a conveyor belt. Five hundred cars are required per day. Production time per day is 420 minutes, and the assembly steps and times for the wagon are given below. Find the balance that minimizes the number of workstations, subject to cycle time and precedence constraints.
- Determine workstation cycle time. Here we have to convert production time to seconds because our task times are in seconds
- Determine the theoretical minimum number of workstations required (the actual number may be greater)


- Select assignment rules.
(a)Prioritize tasks in order of the largest number of following tasks:
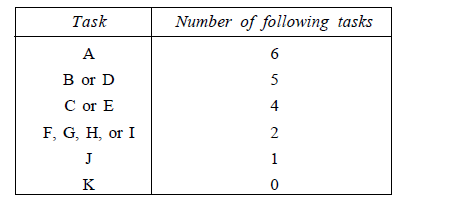
Our secondary rule, to be invoked where ties exist from our primary rule, is (b) Prioritize tasks in order of longest task time. Note that D should be assigned before B, and E assigned before C due to this tie-breaking rule.
- Make task assignments to form workstation 1, workstation 2, and so forth until all tasks are assigned. It is important to meet precedence and cycle time requirements as the assignments are made.
- Calculate the efficiency.
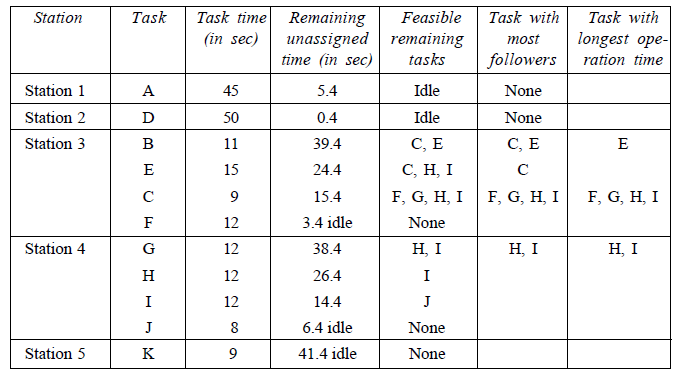

- Evaluate the solution. An efficiency of 77 per cent indicates an imbalance or idle time of 23 per cent (1.0 – .77) across the entire line.
In addition to balancing a line for a given cycle time, managers must also consider four other options: pacing, behavioural factors, number of models produced, and cycle times.
Pacing is the movement of product from one station to the next after the cycle time has elapsed. Paced lines have no buffer inventory. Unpaced lines require inventory storage areas to be placed between stations.
1.2. Behavioural Factors
The most controversial aspect of product layout is behavioural response. Studies have shown that paced production and high specialization lower job satisfaction. One study has shown that productivity increased on unpaced lines. Many companies are exploring job enlargement and rotation to increase job variety and reduce excessive specialization. For example, New York Life has redesigned the jobs of workers who process and evaluate claims applications. Instead of using a production line approach with several workers doing specialized tasks, New York Life has made each worker solely responsible for an entire application. This approach increased worker responsibility and raised morale. In manufacturing, at its plant in Kohda, Japan, Sony Corporation dismantled the conveyor belts on which as many as 50 people assembled camcorders. It set up tables for workers to assemble an entire camera themselves, doing everything from soldering to testing. Output per worker is up 10 per cent, because the approach frees efficient assemblers to make more products instead of limiting them to conveyor belt’s speed. And if something goes wrong, only a small section of the plant is affected. This approach also allows the line to match actual demand better and avoid frequent shutdown because of inventory buildups.
1.3. Number of Models Produced
A mixed-model line produces several items belonging to the same family. A single-model line produces one model with no variations. Mixed model production enables a plant to achieve both high-volume production and product variety. However, it complicates scheduling and increases the need for good communication about the specific parts to be produced at each station.
1.4. Cycle Times
A line’s cycle time depends on the desired output rate (or sometimes on the maximum number of workstations allowed). In turn, the maximum line efficiency varies considerably with the cycle time selected. Thus, exploring a range of cycle times makes sense. A manager might go with a particularly efficient solution even if it does not match the output rate. The manager can compensate for the mismatch by varying the number of hours the line operates through overtime, extending shifts, or adding shifts. Multiple lines might even be the answer.
2. DESIGN OF PROCESS LAYOUT
The analysis involved in the design of production lines and assembly lines relates primarily to timing, coordination, and balance among individual stages in the process.
For process layouts, the relative arrangement of departments and machines is the critical factor because of the large amount of transportation and handling involved.
2.1. Procedure for Designing Process Layouts
Process layout design determines the best relative locations of functional work centres. Work centres that interact frequently, with movement of material or people, should be located close together, whereas those that have little interaction can be spatially separated. One approach of designing an efficient functional layout is described below.
- List and describe each functional work centre.
- Obtain a drawing and description of the facility being designed.
- Identify and estimate the amount of material and personnel flow among work centres
- Use structured analytical methods to obtain a good general layout.
- Evaluate and modify the layout, incorporating details such as machine orientation, storage area location, and equipment access.
The first step in the layout process is to identify and describe each work centre. The description should include the primary function of the work centre; drilling, new accounts, or cashier; its major components, including equipment and number of personnel; and the space required. The description should also include any special access needs (such as access to running water or an elevator) or restrictions (it must be in a clean area or away from heat).
For a new facility, the spatial configuration of the work centres and the size and shape of the facility are determined simultaneously. Determining the locations of special structures and fixtures such as elevators, loading docks, and bathrooms becomes part of the layout process. However, in many cases the facility and its characteristics are a given. In these situations, it is necessary to obtain a drawing of the facility being designed, including shape and dimensions, locations of fixed structures, and restrictions on activities, such as weight limits on certain parts of a floor or foundation.

To minimize transport times and material-handling costs, we would like to place close together those work centres that have the greatest flow of materials and people between them.
To estimate the flows between work centres, it is helpful to begin by drawing relationship diagram as shown in Fig. 2.11.
For manufacturing systems, material flows and transporting costs can be estimated reasonably well using historical routings for products or through work sampling techniques applied to workers or jobs. The flow of people, especially in a service system such as a business office or a university administration building, may be difficult to estimate precisely, although work sampling can be used to obtain rough estimates.
The amounts and/or costs of flows among work centres are usually presented using a flow matrix, a flow-cost matrix, or a proximity chart.
- Flow Matrix
A flow matrix is a matrix of the estimated amounts of flow between each pair of work centres. The flow may be materials (expressed as the number of loads transported) or people who move between centres. Each work centre corresponds to one row and one column, and the element j designates the amount of flow from work centre (row) I to work centre (column) j. Normally, the direction of flow between work centres is not important, only the total amount, so fj and j can be combined and the flows represented using only the upper right half of a matrix.

- Flow-cost Matrix
A basic assumption of facility layout is that the cost of moving materials or people between work centers is a function of distance travelled. Although more complicated cost functions can be accommodated, often we assume that the per unit cost of material and personnel flows between work centres is proportional to the distance between the centres. So for each type of flow between each pair of departments, i and j, we estimate the cost per unit per unit distance, c j.
- Proximity Chart
Proximity charts (relationship charts) are distinguished from flow and flow-cost matrices by the fact that they describe qualitatively the desirability or need for work centres to be close together, rather than providing quantitative measures of flow and cost. These charts are used when it is difficult to measure or estimate precise amounts or costs of flow among work centres. This is common when the primary flows involve people and do not have a direct cost but rather an indirect cost, such as when employees in a corporate headquarters move among departments (payroll, printing, information systems) to carry out their work.
Source: KumarAnil, Suresh N. (2009), Production and operations management, New Age International Pvt Ltd; 2nd Ed. edition.
I have been absent for some time, but now I remember why I used to love this website. Thank you, I will try and check back more often. How frequently you update your site?