1. Measurement
Measurement is the process by which we translate from the theoretical realm to the empirical. Once researchers have selected a concept, they have to find a way to measure it – that is, to identify the type of data they need to collect. Drawing on previous works, the researcher begins by looking at how the concept has been interpreted, or translated, in the past. Studying works by other writers can reveal existing translations that may be directly usable, or could be a basis from which certain adjustments need to be made. If these translations appear unsatisfactory, or unsuited to the current study, then the researcher moves to the second stage of the measurement process, that of developing new translations either by improving existing ones or through innovation.
1.1. Drawing on previous works
Once they have located measurements used in previous works, researchers have to choose among them and, if necessary, consider how they can be adapted to the particular context of their own work.
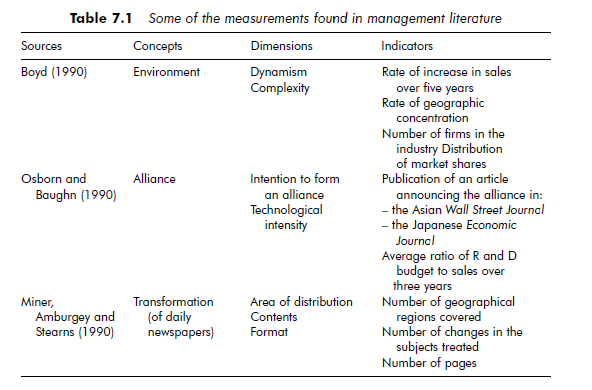
Finding measures When researchers begin in the theoretical realm, they have access to a body of work with differing levels of relevance to their own field. Published articles, doctorate theses and other works can be used as a basis from which to formulate conceptual definitions or look for available measurements. Table 7.1 illustrates several measurements.
Choosing measurement instruments To select the measurement instruments most appropriate to their work, researchers need to consider three criteria: 1) reliability, 2) validity and 3) operational feasibility. As reliability and validity are discussed at length in Chapter 10, here we will look only at the third criteria: operational ‘feasibility’. Although a number of writers have discussed operational feasibility as a selection criterion (Black and Champion, 1976; De Groot, 1969), it is a quality that is best appreciated by drawing on one’s own experience of using a specific measurement.
For example, when considering a scale, operational feasibility is a question of how easy it is to read (the number of items included) and to understand (the vocabulary used). Operational feasibility also relates to the sensitivity of the measurement instruments used, as they need to be able to record subtle variations of the measured concept. The following example illustrates this.
Example: Sensitivity of the measurement instrument
In studying sector-based change in the pharmaceutical industry, a researcher chose to measure the concentration of the sector by calculating the number of companies operating within it. However, she felt that this instrument was not sufficiently sensitive to measure variations in the concept of concentration, as it did not take the size of the companies entering or leaving the sector into account.
Although a company leaving a sector does have an impact on its concentration, the measurement of this variation is identical, whatever the size of the departing company. Yet the size of the companies within the sector can be a significant characteristic of the concept of concentration. The researcher decided to refine the measurement by counting companies according to the following principle: she associated a weighting of almost 1 to large companies, and a weighting closer to 0 for smaller ones.
Even if the measurement instruments used fulfill the requirements of reliability, validity and operational feasibility, researchers may often feel the instruments selected still need to be adapted to suit their particular context.
Making necessary adjustments The research process entails a targeted approach to the empirical world. Researchers should bear this in mind, whether they are interested in a branch of industry, a type of company, or a given type of actors. By taking this into account, as the following example shows, researchers can contextualize the measuring instruments they use.
Example: Contextualized measurement instruments
In a study that encompassed nearly 100 multinational companies, a researcher looked at the influence of the psycho-sociological characteristics of the members of the board of directors on the success of fusion takeovers. He prepared a questionnaire to measure localization of control, interpersonnel confidence and the social anxiety of board members. Only those companies that had bought out others (and not companies which had been bought out themselves) were included in the study, which concentrated on four branches of industry: pharmaceutical, banking, and the insurance and communication sectors.
The researcher chose to address his questionnaire to every board member from each of the companies in his sample. This obliged him to re-examine the formulation of certain questions so that they were better adapted to the respondents’ areas of expertise (commercial, financial, accounts, legal). In this particular research project, however, an additional adjustment was necessary. As the work concerned multinational corporations, the researcher had to translate his measurement instruments, originally conceived in American English, into German, French and Japanese.
Adapting measurement instruments found in published literature to make them more applicable to a new research project can often entail additional work on the part of the researcher.
1.2. Ameliorate or innovate?
When the literature does not furnish satisfactory measurement instruments to measure a given concept, researchers are faced with two possibilities. They can either make significant modifications to available measurement instruments, adapting them to their requirements, or, if none are available at all, they can innovate by constructing their own measurements.
For example, in measuring the concept of performance, a researcher might innovate by using the monthly rate of change in share market prices. This could seem more suitable to his or her needs than another, existing, measurement using the ratio of profit to turnover. If a researcher wishes to use a given scale to measure theoretical items, the scale may be improved by removing, adding or substituting certain items.
It is important to stress that improving or creating measurement instruments is a quasi-integral part of the translation process. Of course, whatever the degree of innovation introduced by the researcher, the measurement instruments constructed must always answer to the requirements of reliability, validity and operational ‘feasibility’. The degree to which these requirements are satisfied determines the limits of the research, and the scope of its results.
Unlike the translation process, which is based on the construction of a measurement, either drawing on existing measurements or adapting them to suit their needs, the abstraction process follows an opposite course. Through abstraction, researchers attempt to establish correspondences, which may be formalized to varying degrees, between the data they have accumulated (behavioral observations, figures, etc.) and underlying concepts – they have to identify the concepts hidden behind their data. In the abstraction process, researchers do not so much aim at processing their data in any definitive way, but at understanding it as accurately as possible.
1.3. Grouping and classifying data
The abstraction process consists of discovering classes of facts, people and events, along with the properties that characterize them. The data a researcher has access to depends essentially on his or her initial field of investigation, which can be used to identify ‘key linkages’ (Schatzman and Strauss, 1973). Key linkages provide researchers with an order of priorities (or attribution rules) when classifying their data.
A number of different principles of data classification have been proposed (Glaser and Strauss, 1967; Lazarsfeld, 1967; Miles and Huberman, 1984a; Schatzman and Strauss, 1973; Strauss and Corbin, 1990). Classes can be established through comparison, using the principle of similarities between phenomena. Such classes are generally referred to as thematic. For example, in studying the daily activities of an operational unit, a researcher may collect a variety of empirical data – such as notes, memos and exchanges – in which he or she finds words, sentences or parts of text of the type: ‘do not forget to write a daily report of your activities’, ‘we remind you that latecomers will be penalized’, and ‘please respect the pricing policy’. The researcher can group these elements together by creating a thematic class ‘reminders of operational rules’.
Researchers can also establish categories according to a chronological principle – respecting the chronological order of the data. Events that occur simultaneously may, for instance, be differentiated from those that occur sequentially. In the study that looked at the activities of a production plant, the researcher could have ordered his or her data according to the idea of action- reaction chains. This involves classifying events by the order they happen: 1) the decision is made to increase productivity; 2) the rate of absenteeism increases. Similarly, the researcher could classify data according to the idea of simultaneous occurrence (the reaction of the workers and the reaction of the supervisors following the directive to increase production).
Categories may also be determined by structural level of complexity. Data is then collated by distinguishing among the different levels of analysis to which they refer. For example, an actor could be classified according to the department in which he or she works, the company in which he or she is employed or the sector the company is in. Another classification possibility relies on more general conceptual ideas, ordering data according to its degree of abstraction. The idea that ‘productivity is closely related to employee satisfaction’ can be classified as an individual belief or as a more abstract phenomenon, such as a collective representation.
Data can also be grouped by considering all possible combinations in terms of categories. This can be facilitated by using appropriate indicators, as the following example, taken from Glaser and Strauss (1967: 211), demonstrates.
Example: Using indicators to construct theory from quantitative data
Glaser and Strauss (1967) developed an example of constructing theoretical elements from quantitative data, by studying the role of professional recognition on scientists’ motivation. The underlying idea in their study was that recognition is induced by motivation, and that motivation leads to greater recognition.
After collating the information they collected, in order to better understand the relationships between them, Glaser and Straus then sorted the data by creating groups of individuals, based on precise characteristics. They formulated indicators to differentiate the various groups – their initial research outline leading them to construct indicators related to the concepts of recognition and motivation. By combining the modalities they had used to measure the concepts of recognition and motivation, namely high levels and low levels, Glaser and Strauss obtained the following indicators: ‘high motivation/low recognition’, ‘high motivation/ high recognition’, ‘low motivation/low recognition’ and ‘low motivation/high recognition’.
These indicators enabled them to differentiate between, and to compare, groups of individuals. More precisely, the authors compared the relative frequency of these various groups to that of a group for which they distinguished only the level of motivation. They found that when motivation was very high there was a difference in the frequency of groups with low recognition and those with high recognition. The comparison allowed them to demonstrate that the effect of recognition is modified by the group’s level of motivation.
This example shows how indicators can be used in the abstraction process. By associating level of performance, level of motivation, and level of recognition, effective conceptual tools were developed. The index ‘high performance/high motivation’ could therefore be referred to as the ‘recursive impact of effort’ – as suggested by literature in human resource management.
Communicating with other researchers can be useful when applying categorization methods. Talking about their work can help researchers present their research more clearly, and to understand their data in a different light than they might through simply writing about it. This effort clearly tends to objectify the data and any interconnections that naturally appear. As Schatzman and Strauss (1973) put it, an audience serves as a ‘conceptual lever’.
The usefulness of these different methods of categorization – as to both the accuracy of the categories and their relevance to the data from which they were created – is appreciated essentially through trial and error (Strauss and Corbin, 1990). To ensure the precision of the abstraction process they employ, or to supplement this process, researchers can draw on formal classification methods (see Chapter 12).
Finally, the researcher too can be considered as an instrument. This concept is closely associated with ethnographic approaches. As Sanday maintains, ‘field- workers learn to use themselves as the principal and most reliable instrument of observation, selection, coordination, and interpretation’ (1979: 527). The translation process is therefore influenced by qualities inherent to the researcher. However, little is known about the nature of this influence. In his book Works and Lives, Geertz (1988), points out that ethnographic work takes on a particular dimension from even the style the researcher uses when transcribing his or her results. The title of his work evokes the ambiguity of the researcher-instrument. There are two realities: that which is studied (there) and that which is reconstructed (here). In studying the style employed by ethnographic researchers, Geertz focuses on transcriptions of research works that do not appear to be objective. This ‘deviance’ is, however, involuntary – it is inherent in the style of writing. In the effort of conceptualization, ethnographers almost unconsciously try to mask or to promote their own behaviors or attitudes. This can lead to abstractions that have followed somewhat inaccurate guidelines.
Ethnographic work often involves significant immersion of the researcher- instrument in the empirical realm. This immersion is punctuated by periods of intense pleasure and joy, but also by other feelings and more somber emotional states. The natural growth and change that occurs to researchers while carrying out their research modifies the instrument that they themselves represent. This is manifested most particularly in the actors’ perception of the researcher. A change in researchers’ behavior can modify the answers they are given or the behavior they observe thereafter. As Barley (1990) noted, researchers are often afraid to make a faux pas, and this fear can lead them to becoming self-conscious – preoccupied with the image they project. This can eventually even divert them from their research object. Drawing on his own experience, Barley explained how, while carrying out research on hospitals, he tried to avoid any discussions that might touch on strongly emotional subjects, accentuating or adapting his behavior at times, and controlling himself from expressing his true beliefs and opinions on sensitive subjects: ‘even though I could not bring myself to laugh at racist or sexist jokes, I also did not confront their tellers’, (1990: 238). Such inhibition cannot be systematic, though, and researchers can help themselves in this respect by taking regular notes on their current emotional states, so that they can ‘contextualize’ their observations when they read them back at a later date.
Source: Thietart Raymond-Alain et al. (2001), Doing Management Research: A Comprehensive Guide, SAGE Publications Ltd; 1 edition.
26 Jul 2021
26 Jul 2021
26 Jul 2021
26 Jul 2021
26 Jul 2021
26 Jul 2021