As stated earlier, cognitive mapping is aimed at establishing and analyzing cognitive maps, that is, representations of a person or organization’s beliefs concerning a particular domain (Axelrod, 1976). A cognitive map is made up of two types of elements:
- Concepts, also known as constructs or variables.
- The links between these concepts. These links can be based on similarity (that is, category schemes; see Rosch, 1978), contiguity, resemblance, influence (that is, influence maps; see Cossette and Audet, 1992), causality between concepts (that is, causal maps; see Huff, 1990) or all of these at once (that is, cognitive maps, Bougon 1983, although certain authors use the term when referring to maps that indicate only causal or influence links between variables).
1. Collecting Data
1.1. Structured or a priori methods
The researcher chooses a set of variables (generally around ten) which he or she considers to be applicable to defining the domain that the map will represent, either based on existing research (Ford and Hegarty, 1984) or on preliminary interviews (Bougon, 1983). Then the links are collected from the respondents by having them consider each pair of variables. For example, does variable A influence variable B? If so, is the influence positive or negative? These links are collected by presenting the respondent with a matrix that cross-references all the variables (Ford and Hegarty, 1984), or pairs of cards with the variables to consider written on them (Bougon, 1983).
Because of the lack of validity of such methods, researchers may prefer to use more natural methods.
1.2. Non-structured methods
When dealing with non-structured methods, as we have seen, data is collected through documents or more open interviews.
Interview methods Researchers collect discourse data through in-depth interviews which are recorded and then entirely transcribed before coding (see, for example, Cossette, 1994). Because of the amount of pre-collection work that these methods entail, some researchers have developed semi-directive methods for cognitive mapping (Ackermann et al., 1992; Eden et al., 1983; Laukkanen, 1989; 1992). The subject is asked about the causes, effects and consequences of the chosen theme for the interview (which will be the central variable on the map). This reveals new variables which are noted down and which can then be submitted to a similar set of questions, and so on and so forth until the person reaches saturation point – that is, has nothing more to say. Thus the map is built interactively with the respondents, who can see it and therefore reflect on their own vision. This method is commonly used to help managers make decisions and formulate strategic problems (Ackermann et al., 1992; Cossette and Audet, 1992). The COPE software developed by Eden (1988; 1990) was in fact conceived essentially with this goal in mind. The main advantage of this method is that it eliminates the need for the researcher to do a lot of coding work. On the other hand, it reduces the possibility of comparing different subjects maps, as they are no longer structured by the researcher beforehand. In addition, since this method implies showing the map to the respondents as they go along, it restricts the validity of the collected data.
Documentary methods The other method available to the researcher is to establish a map based on written documents or interview transcriptions. These methods are mainly used in management for establishing representations of organizations or groups of managers. In these methods, the interview transcriptions or documents collected must be coded by the researcher.
2. Coding Data
2.1. Defining units of analysis
As a cognitive map is a representation composed of concepts and the links that relate them to each other, all of the statements that contain this type of relation should be identified in the text. The type of statement a researcher is looking for will depend on the type of map he wishes to make. We may seek:
- statements containing links of influence (of the ‘A affects, encourages, prevents B’ kind); to construct an influence map
- statements containing causal links (of the ‘A causes B, if A then B’ kind); to establish a causal map
- statements containing similarity links (A is like or unlike B), or hierarchy links (A is included in B, A is an example of B); to construct category schemes
- or all of these links; to construct a cognitive map (Bougon, 1983).
The unit of analysis in cognitive mapping is, therefore, a statement of the ‘concept A/link/concept B’ type (Axelrod, 1976). These statements generally correspond to a sentence like ‘cost-effectiveness encourages corporate growth’ (influence relationship), ‘if cost-effectiveness increases, then corporate growth is encouraged’ (causal relationship), ‘quality concerns are often similar to job- safety problems’ (similarity relationship). Some statements, however, can be spread out over several sentences: ‘The employees are on strike. We won’t be able to deliver to our customers on schedule’ (causal relationship between the two sentences). Since units of analysis do not necessarily correspond to a precise unit of text (for example, sentences), evaluating the reliability of their definition is highly recommended (Axelrod, 1976). The agreement rate between two coders will be calculated in terms of which elements they both consider to be codable in the text (see Robinson, 1957).
2.2. Defining categories
Identifying concepts Once all the statements have been identified, the researcher will attempt to locate within these statements the elements that the speaker considers to be links or influencing or influenced concepts (causes and effects, means and consequences). To facilitate identification of cause and effect elements (or influencing and influenced factors), Wrightson (1976) and Huff (1990) advise asking the following questions:
- ‘Which came first, A or B?’
- ‘Does A logically precede B?’
- ‘Does A necessarily precede B?’
A being the supposed causal concept and B being the supposed effect.
When coding statements in a text, the general rule is not to modify their meaning. Variables are generally preserved in their literal form. However, in order to give the map a more dynamic aspect, it is advisable to transform nominal propositions expressing actions into the corresponding verb (Ackermann et al., 1992). So the variable ‘Increase in the promotional budget’ would be transformed into ‘Increasing the promotional budget’. In addition, concepts should be expressed in the form of a variable, which can require modifying them slightly. For example, the variable ‘product listing’ should be expressed as ‘quality or degree of product listing’.
Identifying links The next step is to search for the nature of the link relating the concepts that have been identified. These links can usually be identified by verbs (such as implies, leads to, prevents, etc.). For causal or influence maps, we generally look for the following links:
- Positive influence or causal links, (graded /+/): leads to, causes, has as a consequence, increases, enables . . .
- Negative influence or causal links, (graded /-/): prevents, harms, damages, reduces, is harmful to, gets in the way of, decreases, diminishes, restricts . . .
- Non-influence links, (graded /0/): has no effect on, is not tied to …
- Positive non-implication influence links, (graded /0 +/): does not entail, does not increase, does not allow/enable, does not lead to …
- Negative non-implication influence links, (graded /0 – / ): does not prevent, does not harm . . .
Besides these categories for qualifying relations of influence between identified variables precisely, Huff (1990) adds a certain number of coding rules which, although their goal is not to code relations of influence per se, do facilitate a later merging of the variables involved in different relations. These rules enable us, in fact, to identify the relations of ‘definition’ – in the broadest sense – expressed by subjects between different variables: particularly relations between examples illustrating a variable’s level (for example, ‘Machine X is a dangerous machine’), and relations of equality (for example, ‘Competition means rivalry between conductors’). These categories allow us to detect connotative links between variables, thereby facilitating their later merging. However, taking these links into account makes data coding more complicated and weighs down the graphic representation that will be established.
The ambiguity of data discourse makes these coding operations difficult. Identifying variables and the links between them is no easy task, and certain links of influence (for example, contingent, interactive or reversible causal relations) have proven themselves to be extremely difficult to handle using the classic rules of coding (Cossette and Audet, 1992). Processing choices made in these cases (not coding them, creating specific coding rules, assimilating them to other relationships) must be specified.
Once the concepts and links in the statements that are considered codable have been identified, we have a list of relationships at our disposal. The next step is to combine the synonymous and redundant variables and influence links.
2.3. Merging similar concepts and variables
This phase involves deciding which variables the researcher considers as similar or synonymous. While the general rule is, when in doubt, leave the variables the way the interviewee expressed them, several guidelines can be of help during this phase (Wrightson, 1976):
- If a variable is mentioned several times by a single respondent, then it is very likely that a modified expression of this variable is nothing more than a stylistic variation. We can then merge the variable and its modified expression, unless the respondent had explicitly specified a distinction between the two.
- If a variable appears to be an example or a part of a more general one, then the two can be merged, as long as they are both expressed by the same person.
- The basic rule underlying this operation is to ask oneself if the respondent’s comments would be fundamentally modified if the merging were carried out.
By combining similar concepts and variables, links can be made between seemingly unrelated variables, which is of great assistance in drawing the interviewee’s cognitive map. In order to facilitate data coding, it is a good idea to make a list of concepts and their corresponding merged terms.
Example: Coding data to establish an influence map
Say we seek to code the following paragraph:
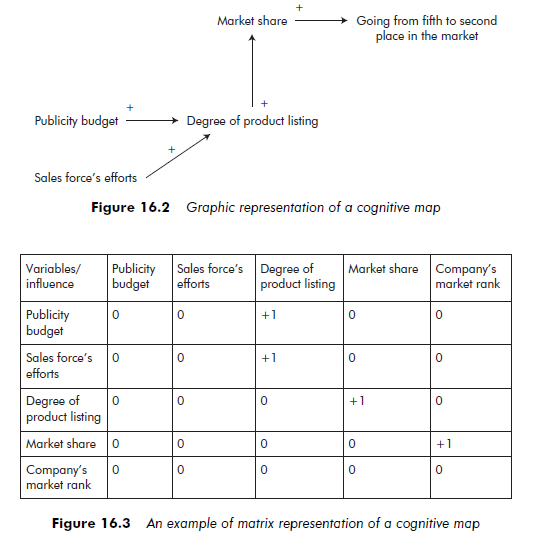
‘Increasing our publicity budget and the efforts on the part of our salesforce enabled us to improve our product listing in mass distribution. So our market share improved considerably, moving us from fifth to second place in our market.’
-
- Identify codable statements
The paragraph contains four codable statements: two in the first sentence (increasing our publicity budget enabled us to improve our product listing in mass distribution; the efforts on the part of our sales force enabled us to improve our product listing in mass distribution), one connecting the first and the second sentences (improving our product listing in mass distribution lead to a considerable improvement in our market share), and one in the last sentence (our market share improved considerably, going from fifth to second place in our market).
-
- Specify the influencing factors/link/influenced factors
The statement ‘increasing our publicity budget enabled us to improve our product listing in mass distribution’ includes an influencing variable (increasing our publicity budget), an influenced variable (our product listing in mass distribution), and a positive influence relationship (enabled us to improve). The following example shows how the statement is coded:
Publicity budget /+/ (Quality or degree of) product listing
This is how the other statements are coded:
Our salesforce’s efforts /+/ (Quality or degree of) product listing (towards distributors)
(Quality or degree of) /+/ Market share product listing
Market share /+/ Going from fifth to second place in our market
-
- Merging synonymous variables
As the coded variables are different from each other, there are no merging operations to do. If, instead of the second sentence, we had had, ‘Better store placement enabled us to improve our market share considerably, going from fifth to second place’, we would undoubtedly have merged the variables ‘degree of product listing’ and ‘store placement’ and kept only one of them.
2.4. Coding reliability
Coding then follows the procedure described above (see Subsection 1.2). Intercoder reliability must be established: (1) for the units identified as codable, (2) for the classification of these units, (3) for merging decisions (see Axelrod, 1976, for calculating reliability rates).
Once the set of relations has been identified and merged, they can be represented graphically (with knots representing the concepts, and arrows the links between them).
2.5. Graphic representations of cognitive maps
Graphic representations can be arranged in different ways. Axelrod (1976) put the factual variables (environmental data, political options) on the left and the goals and consequences on the right (see Figure 16.2). Bougon et al. (1977) draw a map with the variables in a circle, so the final representation looks like a spider web. Eden et al. (1992) arrange them from bottom to top (from the means to the goals). Cossette (1994), using the COPE software, arranges the map in such a way that the distance separating variables that are linked through direct influence is as small as possible.
For someone using a priori methods, a graphic representation is less useful since the maps are subjected essentially to quantitative analysis. They are, therefore, generally left in the form of a matrix.
The matrix in Figure 16.3 corresponds to the map in Figure 16.2. This matrix cross-references the set of n variables included in the map with themselves. Cell ij indicates the absence – value 0 – or presence – non-0 value – of a direct- influence link of the variable in line i on the variable in column j, as well as the polarity of this influence (positive, + 1; or negative, -1).
3. Analyzing the Data
3.1. Analyzing the structure of cognitive maps
Two main types of methods can be distinguished here: (1) methods which evaluate the subjects’ cognitive complexity via general quantitative indicators, and (2) methods which reveal the structural dimensions upon which the subjects have organized their representations.
Complexity indicators In order to apprehend the structure of a cognitive map, one can calculate a set of general complexity indicators:
- The number of variables (Weick and Bougon, 1986) and clusters (Cossette and Audet, 1992; Eden et al., 1992) included in the maps, which are indicators of the degree of differentiation between their constitutive elements.
- The number of links (Eden et al., 1992) and loops (Axelrod, 1976; Cossette and Audet, 1992; Eden et al., 1992; Weick and Bougon, 1986), which are indicators of their degree of interconnection.
These indicators depend largely on the method of establishing influence maps, and particularly on the degree of merging operated between synonymous variables and influence links.
Methods for analyzing the organization of cognitive maps Along with these measurements, there is a set of methods that are more specifically intended to apprehend the organization of the subjects’ representations. We can start by looking for the ‘central’ concepts in the map, that is, the concepts which are either strongly influenced (in which case they are taken as goals to achieve or consequences) or strongly influencing (seen as reasons for the phenomena described in the map or means of acting upon them; Cossette and Audet, 1992). A concept’s centrality is generally defined by the number of direct links which it influences or is influenced by (Hart, 1976), or else by the total number of direct and indirect links influencing or influenced by it, weighted by the average length of the paths linking the factor under consideration to the others (Eden et al., 1992).
The general organization of a map can also be apprehended through cluster analysis. The particular dimensions around which subjects organize their representations are determined in this manner.
Eden’s COPE software enables us to do all of these analyses. The advantage of these methods is that they do not require a priori structuring of the maps or standardization of the variables and links found within them (Daniels et al., 1993), while still enabling comparison between maps from different subjects or from the same subject at different times. On the other hand, they only examine the maps’ organization, and not their content.
3.2. Analyzing the content of cognitive maps
The main purpose of the different methods for analyzing the contents of representations is to compare representations collected from a single subject at different times or from a group of subjects at the same time.
Global methods of comparing the content of cognitive maps Global methods for comparing the contents of individual representations establish general indicators of content similarity based on the complete set of variables and links the representations contain. Within these methods, we generally distinguish between measures of distance and of similarity.
Distance measures Distance measures are generally based on the Euclidean notion of distance. Nevertheless, due to a desire to compare the measurements obtained and to apply these ratios to different types of maps, these measurements quickly became more complex – through weighting, taking into account the strength of the links, the possible number of polarities in the influence links, the nature of the variables – receptive or transmitting – the unique nature of certain types of variables, the strength of the beliefs relative to the existence of links and so on (Langfield-Smith and Wirth, 1992; Markoczy and Goldberg, 1993). Despite the increase in the formulae’s complexity and adaptability, these methods still require some structuring of the maps by the researcher: either through a priori collection methods or through ex post merging of the variables and links used by the subjects (Daniels et al., 1993). They thus reduce the validity of the individual maps; and are not very well-adapted to maps generated by nonstructured methods.
Similarity measures To establish similarity measurements, we first need to find the number of points in common between the different spaces to be compared in terms of links or variables, which can be weighted by the number of common and different points available (see, for example, the Jaccard or Dice indices; see Jaccard et al., 1990). Like distance measures, these ratios require a certain amount of standardization of the links and variables. However, unlike distance measures, the researcher can perform these operations ex post. These measures also have the advantage of being founded on dimensions shared by the maps that are being compared – the results obtained are then easier to interpret.
Aside from these mathematical evaluations, Daniels et al. (1993) suggest asking independent judges to evaluate the degree of similarity of pairs of maps. The average evaluation established in this manner will be retained as an indicator of their similarity. Unlike the preceding mathematical methods, turning to qualitative methods has the following advantages:
- It enables comparison between entirely idiosyncratic maps. Neither a priori nor ex post structuring is required.
- It is not contingent to a particular type of map.
These characteristics undoubtedly endow these methods with greater validity than mathematical measurements. Unfortunately, the size of the maps to be compared poses serious problems. Although it is easy to use qualitative evaluation for maps containing 10 to 50 variables, it becomes much less so when evaluating similarity for idiosyncratic maps that can contain 100 to 200 concepts. It can, therefore, be useful to focus analysis on a part of a cognitive map, rather than on the whole.
Local methods for analyzing the content of cognitive maps This is one of the purposes of domain analysis. Domain analysis was developed by Laukkanen (1989; 1994) for comparing maps from different subjects or groups thereof. These analyses bear on sub-maps made up of factors that are to some extent directly influenced by, or influence, a variable that particularly interests the researcher. The CMAP2++ software developed by Laukkanen automatically generates to this effect databases made up of all the links and variables included in the submaps in which that variable is inserted. These lists of links and variables are easy to represent graphically and to analyze qualitatively (see Laukkanen, 1994) by, for example, collating the chains of factors influencing or influenced by a variable included in different subjects’ sub-maps.
These analyses, bearing on the structure and contents of cognitive maps, can serve different research purposes. Up until now, most research concerned map analysis as such (see Cossette and Audet, 1992) or the elaboration of analysis methods (see Laukkanen, 1992; Eden et al., 1979; 1983). But cognitive maps can also serve to explain or to predict other behavioral variables or organizational phenomena (Komokar, 1994; Axelrod, 1976) and to assist in decision making (Eden et al., 1983; Eden, 1988; 1990; Eden and Banville, 1994).
Source: Thietart Raymond-Alain et al. (2001), Doing Management Research: A Comprehensive Guide, SAGE Publications Ltd; 1 edition.
26 Jul 2021
26 Jul 2021
26 Jul 2021
26 Jul 2021
26 Jul 2021
26 Jul 2021