Beyond simply counting, evaluators might look for an association between two or more variables. In the Stars and Stripes assignment, the frequency of news articles on various topics was compared between the Pacific and European editions. In the language of content analysis, the variable “topic” was compared to the variable “edition.” Topic had the subcategories military, Iran-contra, AIDs, strategic treaty, and presidential campaign.
The final Stars and Stripes report contained a table similar to table 5.1, with which we can examine the association between topic and edition. If the data were to show that knowledge of one variable provides us with knowledge about the other, we would then say that the variables were associated. For example, suppose we have a bin containing 100 randomly chosen articles from the Pacific edition and 100 from the European edition. If we randomly select one article from the bin, and if it is about Iran-contra, does knowledge about that topic tell us which edition the article appeared in? If the answer is yes, the two variables are associated.
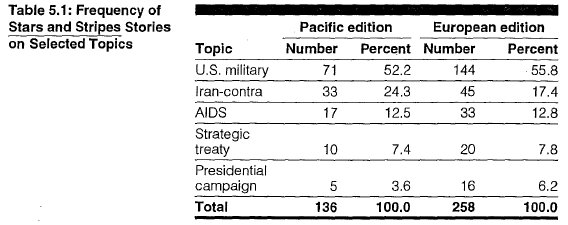
Table 5.1 shows that the percentage of articles on Iran-contra was somewhat greater in the Pacific edition; the percentage of articles on the presidential campaign was somewhat greater in the European edition. The remaining categories do not show much difference. Thus, there may be a weak association between topic and edition. That is, topic only is somewhat predictable from edition, or edition only is somewhat predictable from topic.
A table like this may disclose a relatively strong relationship between variables, but often the relationship is ambiguous. By subjecting the data to a statistical analysis, moderate or weak associations can readily be established. Because both variables are unordered—that is, they are nominal variables—we could compute a statistic like Cramer’s V with statistical software.1 Cramer’s V ranges from 0, indicating no association, to 1, indicating perfect association. The data in table 5.1 yield a value for V turns of 0.09, a very modest degree of association.
Source: GAO (2013), Content Analysis: A Methodology for Structuring and Analyzing Written Material: PEMD-10.3.1, BiblioGov.
18 Aug 2021
18 Aug 2021
18 Aug 2021
18 Aug 2021
18 Aug 2021
18 Aug 2021