There are a number of ways to identify trends. One way to determine a trend in a data set is to run a linear least-squares regression. This statistical process will provide information about the trend in security prices. Unfortunately, this particular statistical technique is not of much use to the technical analyst for trend analysis. The regression method depends on a sizable amount of past price data for accurate results. By the time enough historical price data accumulates, the trend is likely changing direction. Despite the tendency for trends to be persistent enough to profit from, they never last forever.
Box 2.1 Linear Least-Squares Regression
Most spreadsheet software includes a formula for calculating a linear regression line. It uses two sets of related variables and calculates the “best fit” between the data and an imaginary straight (linear) line drawn through the data. In standard price analysis, the two variable data sets are time and price—day d1 and price X1, day d2 and price X2, and so forth. By fitting a line that best describes the data series, we can determine a number of things. First, we can measure the amount by which the actual data varies from the line and, thus, the reliability of the line. Second, we can measure the slope of the line to determine the rate of change in prices over time, and third, we can determine when the line began. The line represents the trend in prices over the period of time studied. It has many useful properties that we will look at later, but for now, all we need to know is that the line defines the trend over the period studied. Appendix A, “Basic Statistics,” provides more detailed information about least-squares regression.
Many analysts use moving averages to smooth out and reduce the effect of smaller trends within longer trends. Chapter 13, “Breakouts, Stops, and Retracements,” discusses the use of moving averages.
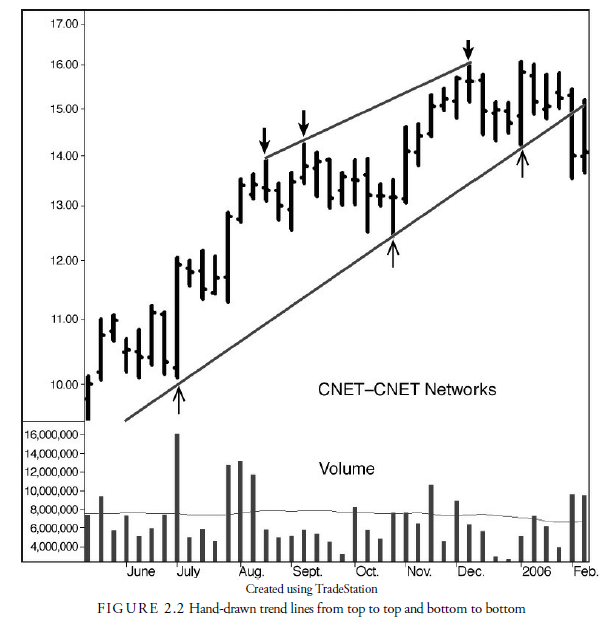
Another method of identifying trends is to look at a graph of prices for extreme points, tops, and bottoms, separated by reasonable time periods, and to draw lines between these extreme points (see Figure 2.2). These lines are called trend lines. This traditional method is an outgrowth of the time before computer graphics software when trend lines were hand drawn. It still works, however. Using this method to define trends, you must define reversal points. Chapter 12, “Trends—The Basics,” covers several methods of determining reversal points, but most such points are obvious on a graph of prices. By drawing lines between them, top to top and bottom to bottom, we get a “feeling” of price direction and limits. We also get a “feeling” of slope, or the rate of change in prices. Trend lines can define limits to price action, which, if broken, can warn that the trend might be changing.
Source: Kirkpatrick II Charles D., Dahlquist Julie R. (2015), Technical Analysis: The Complete Resource for Financial Market Technicians, FT Press; 3rd edition.
7 Jul 2021
7 Jul 2021
7 Jul 2021
7 Jul 2021
7 Jul 2021
8 Jul 2021