Although the practice of technical analysis in some forms likely dates back many centuries, Charles Dow (1851-1902) was the first to reintroduce and comment on it in recent times. He is considered the father of “modern” technical analysis. Dow’s introduction of stock indexes to measure the performance of the stock market and by inference the prospects for the economy allowed for a major advance in the sophistication of stock market participants.
Dow was a lifelong newspaper journalist. His specialization in covering financial news began with a mining story he wrote when working for the Providence Journal (Rhode Island) in 1879. In 1880, Dow relocated to New York, where he continued covering the mining industry. In 1882, Dow joined with Edward Jones and Charles Bergstresser to form Dow, Jones & Company. The company offices were located behind a soda shop that was located next door to the entrance of the New York Stock Exchange. The company wrote handwritten news bulletins and distributed them by messenger to customers in the Wall Street vicinity.
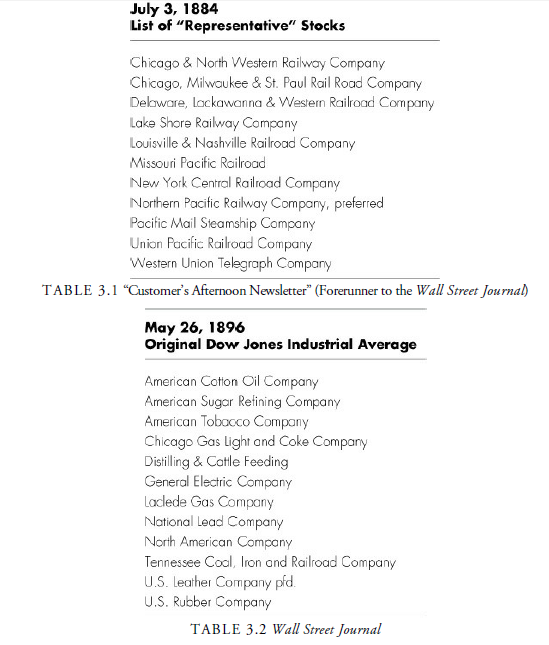
On July 3, 1884, Dow published his first version of a stock index in the company’s “Customer’s Afternoon Newsletter.” Dow calculated this price-weighted average simply by summing the prices of the stocks in the index and dividing by the number of stocks. This index included a total of 11 stocks—9 railroads and 2 industrials.
Table 3.1 shows the companies that Dow included in this first index. Although this might seem to be an odd combination by today’s standards, the index was consistent with the important role the railway companies played in the economy of the 1880s. In February 1885, Dow began publishing a daily index of actively traded, highly capitalized stocks. This index contained 12 railways and 2 industrial stocks. By January 1886, Dow replaced the 14-stock index with a 12-stock index, containing 10 railroads and 2 industrials. By May 1896, Dow recognized the increasing role the emerging industrial sector was playing in the U.S. economy and altered his index so that it consisted entirely of industrial stocks. The first version of the Dow Jones Industrial Average (DJIA) appeared in the Wall Street Journal on May 26, 1896, and included the 12 stocks listed in Table 3.2. Although all of these companies survive in some form today, only General Electric remains a component of the DJIA.
Dow’s initial index of rail stocks was renamed the Railroad Average. The Railroad Average developed into the modern-day Dow Transportation Average on January 2, 1970, when it included nonrailroad stocks such as airlines and truckers. As of today, of the 20 stocks in the Transportation Average, only four are railroad stocks —CSX Corp., Kansas City Southern, Norfolk Southern Corp., and Union Pacific Corp. Indeed, reflecting the changes in transportation since its composition, the Transportation Average now includes two shipping companies, five airlines, three trucking companies, two leasing companies, and four air delivery and freight services.
In 1916, 14 years after Charles Dow’s death, the DJIA expanded to 20 stocks. It was not until 1928 that the index further expanded to 30 stocks. Although the average has been updated to reflect the changing composition of trading-market conditions, market capitalization, and industrial composition, the practice of including 30 stocks continues today.
Dow’s original intent was to use these averages as predictors of the economy, but his analysis took a life of its own, and his theories became known as the “Dow Theory.” (See Chapter 6, “Dow Theory.”) They are the foundation for modern technical analysis. The principles that Dow established are still valid today, albeit in a different form.
However, Dow’s contribution to the field of technical analysis goes beyond the creation of indexes. The Dow Jones Company was the first in the United States to publicly report stock prices. Private subscription letters with stock prices had existed earlier but were available only to the few who paid directly for them. The reporting of prices on a consistent basis provided the “meat” for technical analysis. Motivation came from the many wide swings in prices both from legitimate news and information as well as from manipulation. By watching prices, investors and traders hoped to gather information on who was buying and selling shares and, thus, what the prospects for future prices might be. Technical analysis is a means for the uninformed to become informed.
With recording of prices and the calculation of averages, analysts began to see that prices often traded with certain repetitive patterns. They also noticed that market dynamics are complicated and influenced by people and their own way of looking at investments, their own periods of interest, their own information, and their own emotions. Patterns in market averages, specifically the “line” and the “double” top or bottom, were first mentioned by Charles Dow and his subsequent followers, William Peter Hamilton, S. A. Nelson, and Robert Rhea, in the 1920s. Richard D. Wyckoff offered a successful correspondence course in trading and investing, principally using technical analysis theories, in 1931. Earlier, in the 1920s, he published a technical newsletter that reached more than 200,000 subscribers.
Also in the 1920s and 1930s, classic indicators such as the advance-decline line (A/D line) were created. Colonel Leonard P. Ayres (1940) developed an early measure of business confidence and is considered the originator of the A/D line. Ayres ran a company called Standard Statistics. In 1941, Standard Statistics merged with a company headed by Henry Poor; this new entity became Standard and Poor’s.
Richard W. Schabacker, the financial editor of Forbes magazine and of the New York Times, began to recognize individual stock patterns and observed many common characteristics between different issues. He is probably the first person to use the words triangle, pennant, and head-and-shoulders to describe chart formations we consider in future chapters. Schabacker authored Stock Market Theory and Practice (1930), Technical Analysis and Market Profits (1932), and Stock Market Profits (1934). The commodity markets, which had long depended on price action for their speculative activity, also evolved their share of special technical theories. This was the age of speculation, inside information, and manipulation with little regulation. Those outside the information loop were at a disadvantage. Technical analysis made the difference by using price action as a predictive tool.
During the late 1930s and much of the 1940s, little was written about stock market analysis. If we consider the business and economic climate at that time, it is not surprising that there is a void in the literature. After the Securities Act of 1933 and the Securities Exchange Act of 1934, Graham and Dodd published one of the few pieces of security analysis of the period. In their book Security Analysis (1951), Graham and Dodd established the fundamental analysis side of investment analysis, which is concerned with economic conditions and company value. Although this book provides the groundwork for the development of fundamental analysis, a closer reading of it reveals that Graham and Dodd did not believe that fundamental analysis alone determined stock prices. For example, consider the following passage from their book:
The influence of what we call analytical factors over the market price is both partial and indirect—partial, because it frequently competes with purely speculative factors which influence the price in the opposite direction; and indirect, because it acts through the intermediary of people’s sentiments and decisions. In other words, the market is not a weighing machine, on which the value of each issue is recorded by an exact and impersonal mechanism, in accordance with its specific qualities. Rather we should say that the market is a voting machine, where on countless individuals register choices which are the product partly of reason and partly of emotion. (p. 28)
It was not until 1948 that Robert Edwards (son-in-law to Schabacker) and John Magee (see Figure 3.2) published the first edition of Technical Analysis of Stock Trends. Edwards and Magee demonstrated the technical patterns observed in hundreds of stocks. Their interpretations are still used to this day, and technicians know their book as the “bible of technical analysis.” In fact, the tenth edition of the book was published in 2012.

At first, prices were recorded and then plotted by hand. Indeed, even today, strict followers of point-and- figure technique plot their charts by hand, as do many specialists and traders who want to get the “feel” of the stocks they are trading. Chart services published books of hand-plotted charts for those who could not afford the time to check for accuracy and plot their own charts.
As technical analysts became increasingly comfortable with more complex mathematical tools, they focused on more than just the chart patterns of their predecessors. Analysts began using more advanced mathematics to describe price action. The most prominent technical analyst of the 1950s was Joseph Granville, who worked for E. F. Hutton and published a short article on the Barron’s Confidence Index in Barron’s in 1959. After this article, Granville wrote two books in which he covered on-balance volume, the 200-day moving average, and other tools and concepts that are still popular today. Some of the other great technicians during this time were Kenneth Ward, Humphrey Neill, William Jiler, Edmund Tabell, L. M. Lowry, John Schultz, D. G. Worden, Harold Gartley, Garfield Drew, Ralph Rotnem, Abe Cohen, James Dines, and George Lindsay.
In the 1960s, the concept of rate of change (ROC), or momentum, became one of the technician’s tools.
By the late 1970s, computer technology was available to draw charts more accurately and with greater speed. In addition, ratios, oscillators, and other more arcane calculations could be moved from the adding machine to the computer for quicker calculation and more thorough testing. The computer changed the face of technical analysis forever.
One of the most popular technical tools developed in the 1970s was the relative strength index (RSI), created by J. Welles Wilder, Jr. (see Figure 3.3). One of the most inventive technicians, Wilder is also credited with the Directional Movement concept, the Parabolic System, and Average True Range, all still used today. Another technician and commodity trader, Richard Donchian, promoted the use of the 10-day and 20-day moving averages crossovers as buy and sell signals, as well as the “4-week” rule, whereby a price break above or below the four-week high or low indicated the initial stage of a new trend. Focusing on the options market, technician Martin Zweig examined the use of the put-call ratio. Various moving average indicators were developed, such as moving-average envelopes, moving-average crossover, and the Moving-Average Convergence/Divergence (MACD) oscillator, by technicians like Fred Hitschler and Gerald Appel. We mention many other inventive technical analysts in later chapters when we cover their specialties.
Just as the mathematical sophistication and computer technology was allowing for great advances in the development of technical analysis, technical analysis came under fire by the academic community. Academics argued that technical analysis was impossible because prices were randomly distributed and had no history embedded in them that could predict future prices. At the same time, proponents of the Efficient Markets Hypothesis argued that markets were efficient and that news, information, and so on was immediately and rationally discounted in the markets. Because no means of price study could anticipate such news, technical analysis was a futile study. Gradually, professional money managers, most of whom were raised and trained at business schools in this antitechnical school of thinking, closed their technical departments, and technical analysis went into a decline.
However, while the academic community was discounting the use of technical analysis, the technical analyst’s access to more powerful computers and better data was rapidly increasing. The fast computers and accessibility to a large data set of clean post-World War II data allowed analysts to attempt to optimize their trading strategies, taking past price data and performing numerous calculations to determine which of a number of strategies would have yielded the best profits. These optimized results could be used to develop future trading strategies, assuming that the markets would behave similarly in the future.
Ironically, although the dawning of the computer age brought new, increasingly sophisticated technical tools to the study of technical analysis, the development of these tools coincided with the introduction of an ancient technical tool to the U.S. financial markets. As we discussed earlier, Japanese candlestick charts dated back to the mid-1700s; however, the western financial markets had not had access to the Japanese writings and technical tools. Steve Nison introduced candlestick charts into U.S. technical analysis in the late 1980s. Since then, numerous other chart types like Kagi, Kase, Renko, and Ichimoku Kinko have been added to the list of visual analysis methods.
Source: Kirkpatrick II Charles D., Dahlquist Julie R. (2015), Technical Analysis: The Complete Resource for Financial Market Technicians, FT Press; 3rd edition.
Excellent web site. Lots of helpful info here. I¦m sending it to a few pals ans also sharing in delicious. And certainly, thanks in your sweat!