The patterns we have considered up to this point have been defined by straight lines. When we begin to define patterns with curved lines, we become more indefinite than with using straight lines such as trend lines. This does not make the patterns any less useful, but it does make them more difficult to describe specifically.
1. Rounding Top, Rounding Bottom (Also “Saucer,” “Bowl,” or “Cup”)
Rounding tops and bottoms are formed by price action that reverses slowly and gradually, rather differently from the spike with definite and sharp reversal characteristics. Volume in the bottoms seems to follow the same trend of lessening as prices gradually approach the bottom and increasing as they gradually turn upward again. In a rounding top, volume tends to follow the same pattern of lessening as prices decelerate and increasing as prices gradually turn down. Rounding usually takes time, and within its process, it has many minor up and down, short-term trends. Rounding is, thus, more conceptual than specific.
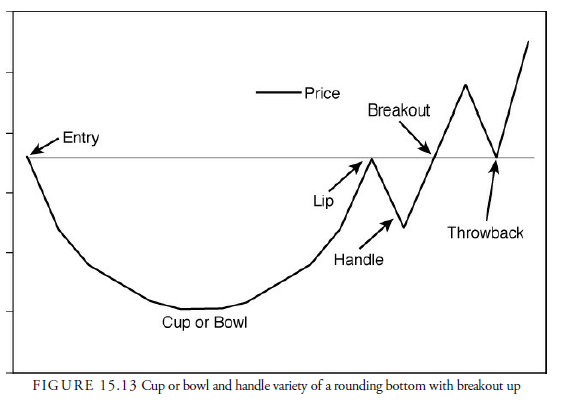
However, many formations depend on rounding for their description. The most famous is the “cup-and- handle” formation described in detail by O’Neil (1988) but referred to in many earlier publications. This formation, as shown in Figure 15.13, is a variation of the rounding bottom that shows a lip after the rise from the bottom and a small congestion area that reverses downward for a short while called a handle. The high of the lip establishes, in this type of rounding bottom, the resistance level to watch for an upward breakout. Sometimes the breakout never occurs, and prices keep declining in the handle, continuing to new lows. Traditionally, the cup-and-handle is considered to be a bottoming reversal pattern. However, Bulkowski has found that when it is a continuation pattern from an earlier low, it is much more reliable and profitable. It still only ranks 13 out of 23, despite its popularity.
Rounded bottoms are more common than rounded tops, but neither materializes often. They tend to be longer-term patterns, more easily identified in weekly or even monthly charts. They are reversal patterns, but they can also appear in long price consolidations. Shorter-term rounded formations, often called scallops, are usually continuation patterns that are equally difficult to define. Rounded bottoms rank 5 out 23 in performance and have a low 5% failure rate. Tops have the same performance rank, when breaking downward, but a slightly higher failure rate of 9%—12%. They are difficult to recognize and often require weekly or monthly charts to identify. They are also difficult to trade. First, the breakout level is not easily defined, except in cup-and-handle patterns. Second, they are slow to develop and often fail to break out.
2. Head-and-Shoulders
The head-and-shoulders pattern is probably the most famous technical pattern. Its name is often used when ridiculing technical analysis, yet its profitability is high, relative to other patterns, and it is one of the few that the Lo, Mamaysky, and Wang (2000) study showed had statistical significance.
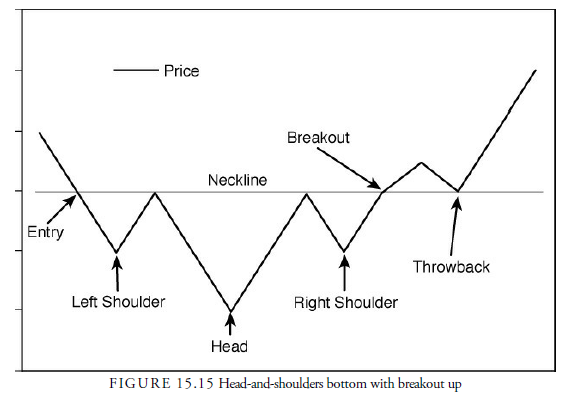
Head-and-shoulders is a complex pattern because it combines all three potential characteristics of a pattern: trend lines, support or resistance lines, and rounding. It is most often seen at a top or bottom, but it can occur in its normal state or as a failed formation in a consolidation. Mostly, it should be traded only after it has formed completely. Its complexity causes many impatient analysts to anticipate its formation and to act prematurely. Its performance and success rate are high, but only after it has formed completely and satisfied all its requirements. We describe the traits of a head-and-shoulders top. The bottom formation (see Figure 15.15) is the reverse in every way except where noted.
An uptrend, but not necessarily a long-term trend, precedes a head-and-shoulders top. Thus, as shown in Figure 15.14, the head-and-shoulders top pattern is entered from below. (The head-and-shoulders pattern can also occur within a consolidation rather than at the end of a trend, but such occurrences are rare and more likely a series of triangles or a rectangle with a false downward breakout at the “head.”)
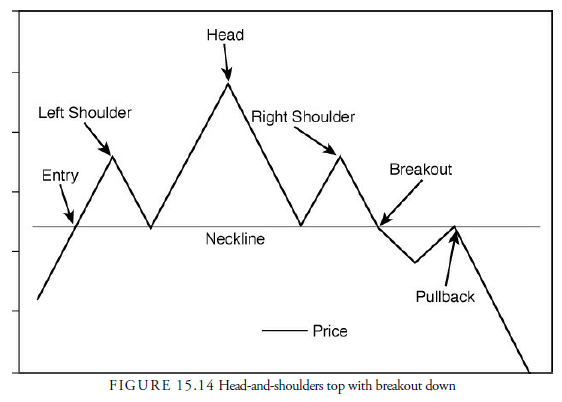
The head-and-shoulders top pattern is a series of three well-defined peaks, either sharp or rounded. The second peak is higher than the first and third peak. This middle, higher peak is called the head. The first peak is called the left shoulder, and the third peak is called the right shoulder. Both the left and right shoulders must be lower than the head, but the two shoulders do not have to be the same height. In fact, a left shoulder peak slightly higher than the right shoulder peak adds a little to the postbreakout performance of a top formation. (A head-and-shoulders bottom is pictured in Figure 15.15. In the bottom pattern, a right shoulder low that is slightly lower than the left shoulder low adds to performance.)
The peaks in the head-and-shoulders top formation are roughly equidistant from each other. The shoulders should appear roughly symmetrical about the head and should peak at roughly the same level. Symmetry is important and makes the formation more identifiable. Occasionally, more than two shoulders appear. These formations are called “complex head-and-shoulders” and have roughly the same performance and failure rates as the standard two-shoulder variety. As in the standard, the multiple shoulders appear symmetrically on both sides of the head. Rarely, a “two-headed” variety appears, and it, too, shows the same performance and failure rates as the standard. There is also the “unbalanced” version, as described by Edwards and Magee, but it is difficult to describe accurately and seems to fit only those formations that might be head-and-shoulders but cannot be formally categorized as such. The standard is the most common and the one to look for.
The bottoms between the peaks form a recognizable trend line. Technicians call this line the neckline. Although the neckline is often horizontal, as in a support line, it also can be downward or upward sloping. Indeed, there is some evidence that an upward-sloping neckline in a top formation produces better performance than the standard horizontal neckline. (In a bottom formation, the same rules hold except the neckline is now resistance rather than support. In a bottom formation, a downward-sloping neckline increases postbreakout performance over an upward-sloping neckline but not over the horizontal one.) Tilting the slope of the neckline to an extreme, however, destroys the head-and-shoulders pattern and its likely consequences.
Volume is usually highest on the rise into and at the peak of the left shoulder and decreases throughout the formation. This is not a requirement, however, because those formations with decreasing volume, although slightly less frequent, have a slight performance edge at tops. (Increasing volume has a slight edge in head-and- shoulders bottoms.) Higher volume on either shoulder does not affect performance at a top, but a bottom, higher volume on the right shoulder than on the left shoulder adds considerably to postbreakout performance.
Breakout and action signals occur when prices, after completing the right shoulder, break below the neckline. The breakout is a requirement for the formation. Second-guessing before completion of the pattern can be dangerous. Sometimes the right shoulder does not form completely, and prices fall short of breaking the neckline and rise to penetrate above the right shoulder peak. Not only is this a failure, but it also is an opportunity, provided the analyst had not anticipated a breakdown and acted prematurely. The head-and- shoulders failure of this type is profitable, according to Schwager (1996). The standard failure, however, is when prices break below the neckline and then reverse back upward through the right shoulder. This kind of failure is relatively rare.
The breakout often occurs on increased volume, but decreased volume is not a sign of an impending failure. It just occurs less frequently. Increasing volume on a bottom formation improves performance, whereas decreasing volume on the breakout from a top pattern increases performance.
Pullbacks or throwbacks are frequent—roughly 45%-63% for bottoms and 60%-67% for tops. In summary, the head-and-shoulders pattern—aside from being the best known, even among nontechnicians—is the most reliable and profitable of the classic formations.
The performance rank for the standard head-and-shoulders top is 1, the highest ranking possible. Complex tops have a rank of 3, standard bottoms a rank of 7, and complex bottoms a rank of 9. Both top and bottom patterns, therefore, are high on the list of performance.
We have seen in most other patterns that when a pullback or throwback occurs, the comparative performance suffers. This is also true in head-and-shoulders patterns. The failure rates for both top and bottom formations are low. Only 3%—4% failed a 5% gain or more from tops and bottoms. In short, the head-and-shoulders formation has a high rate of reliability as well as profitability.
Box 15.9 Trading Head-And-Shoulders Patterns
Once a pattern has been observed using the preceding descriptive features, the neckline becomes the most important factor. The neckline is where the breakout level resides. Never should one act in anticipation of a break through the neckline. The risk of failure is too great, and as we have seen with the upward break of a descending triangle, the strongest upward formation, the rise from descending peaks and a flat neckline, can be substantial. This is equally true with head-and-shoulders bottom formations. The ascending triangle with a breakout down is also a powerful formation. Thus, breakout stops should be placed outside the right shoulder reversal point. Once the breakout is triggered, the risk of failure declines substantially. If the breakout is through the neckline, use the standard statistics as a guide, but if the breakout is a failed head-and-shoulders through the right shoulder extreme, use the appropriate triangle statistics as a guide.
The price target for a head-and-shoulders pattern is relatively accurate. It is calculated like the others by taking the height of the formation and projecting it up or down from the breakout price. The height is measured by drawing a vertical line from the peak of the head to where it intersects the neckline and measuring the number of points between the two. This holds for flat as well as sloping necklines.
3. Shorter Continuation Trading Patterns—Flags and Pennants (Also “HalfMast Formation”)
For efficient use of trading capital, consider trading with flags and pennants. They are frequent formations with extremely rapid and relatively reliable outcomes. After a breakout in either direction or either pattern, prices usually run immediately, having few pullbacks or throwbacks and low rates of failure. Some successful traders use only flags and pennants because of these advantages. Flags and pennants are really variations of the same formation. The flag is a short channel that usually slopes in the opposite direction from the trend. The pennant is a short triangle that does the same. Both of these patterns are pictured in Figure 15.16.
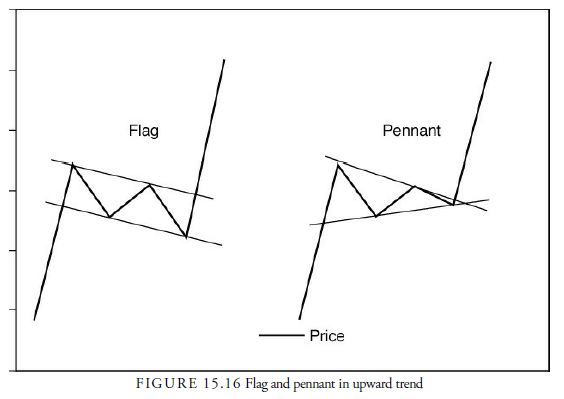
Both flags and pennants are preceded by a steep, sharp price trend, best at 45 degrees rather than straight up. Flags preceded by a rise of 90% or more have almost a zero failure rate and an average return of 69%. This variety is the best of all chart patterns. Two parallel trend lines in a small channel that resembles a flag form the pattern, and the slope of the channel can be in any direction, but most commonly the best performance comes when it slopes away from the preceding trend. Flag formations occur over a short period—usually a few days to a few weeks; the best flag is less than 15 days. Volume usually declines throughout the formation of the flag. In fact, this downward trend in volume is found in almost four out of every five flags that occur.
The pennant pattern is the same as the flag except that the trend lines converge, forming a miniature triangle, instead of being parallel. The direction of the formation is usually opposite from that of the immediately preceding price trend, but in stronger moves, it can be horizontal or even trending in the same direction as the underlying trend. Pennants differ from wedges in that they are shorter in time and require a sharp move preceding them. Wedges tend to be longer-term patterns. Falling volume throughout the formation is even more common with pennants; 90% of pennants are characterized by a downward trend in volume.
Two types of failures can occur. First, a breakout in the opposite direction from the previous trend can occur. Second, a failure can occur after breakout. Because a flag or a pennant is usually a continuation formation, the breakout should be expected in the direction of the preceding trend, provided it is steep and sharp. When the breakout goes opposite to that trend, the failure invariably returns to the earlier trend, but only after a few heart palpitations have occurred first and a few protective stops have been triggered.
Box 15.10 Trading Flags and Pennants—Measured Rule
Because these patterns have low failure rates, few pullbacks or throwbacks, short time periods, and steep trends preceding and following their occurrence, they are very good trading patterns.
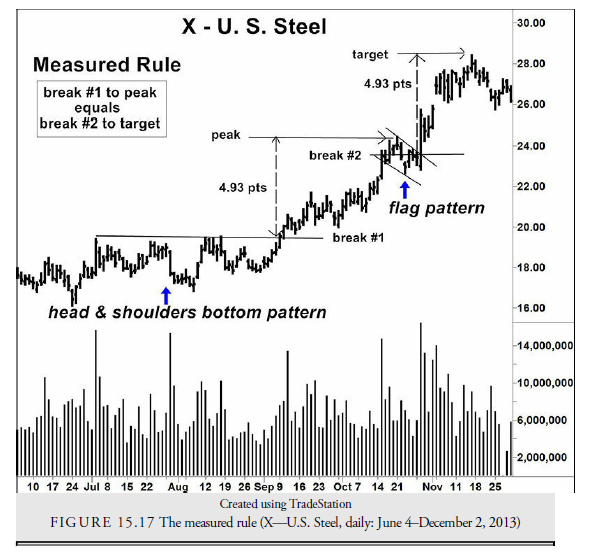
One of the most important identification features is the steep trend preceding the pattern. It is important to be cautious to make sure that a complete formation has occurred and to wait for the breakout. The breakout occurs when a trend line is broken, usually in the direction of the preceding trend. The price target for these patterns is calculated by taking the distance from the beginning of the sharp trend, not necessarily the beginning of the entire trend, to the first reversal in the pattern and adding it to the breakout price. This method is called the measured rule (see Figure 15.17) and usually applies only to flags and pennants. It implies that the formation will occur roughly halfway through the entire steep price trend; because of this, these patterns are also called half-mast patterns. The projection of a target is only partially accurate (about 60% of the time), but because of the steepness of the subsequent trend, close trailing stops are the best manner of protecting profits.
Source: Kirkpatrick II Charles D., Dahlquist Julie R. (2015), Technical Analysis: The Complete Resource for Financial Market Technicians, FT Press; 3rd edition.
I’m not sure where you’re getting your information, but good topic. I needs to spend some time learning much more or understanding more. Thanks for great info I was looking for this information for my mission.