We begin by looking at classic chart patterns. These patterns generally have been recognized and used for more than a hundred years. Only recently have there been tests of their reliability and profitability.
1. Double Top and Double Bottom
A double formation is about the simplest of the classic formations. A double top consists of only three reversal points: two peaks separated by a trough (refer to Figure 15.1 on page 335). For it to be a true double top, the initial price must enter the pattern from below the trough price, and the exit signal must occur on the breakout below the trough low price. The best performing of the double tops is the “Eve and Eve” double top patterns. The tops are rounded and wide with some irregularity. According to Bukowski, the two peaks must be at or within 5% of each other’s price level, and the middle valley should be around 10% or more from the lowest peak. The double top, thus, resembles the rectangle formation (described next) with less detail. The pattern forms over 2 to 6 weeks: the longer, the less reliable. A projection from the break below the trough is under the Measured Rule that hypothesizes a decline equal to 73% of the distance in points from the highest peak to the trough. The double bottom is the mirror image of the double top.
Newspaper and media commentators who want to sound like technical analysts frequently use the term double formation often when it is not a true double pattern. A true formation is only valid when the intervening reaction reversal point has been penetrated. The danger of acting prematurely is great; roughly 64% of these patterns fail to penetrate the breakout level and instead continue on their original trend. When the pattern is completed with a breakout, however, it is very accurate.
The failure rates are 11%. This means that the odds of making a profit from a double top downward breakout are minimally risky. Bulkowski ranks the overall performance rank at 2 out of 21, a very high ranking. This ranking is a composition of the pattern’s failure rate, average profit, pullback/throwback rate, and percent of trades reaching a price target.
Box 15.3 Trading Double F ormations
If one observes a double pattern, several important observations must be made before acting to improve the chances of profit. First, never buy until the breakout has occurred. Second, look for flat bases either at the same level as the twin bottoms or slightly higher and earlier. Third, look for an absence of a consolidation area above the formation. Fourth, look for what is called an “Eve & Eve” variety. Volume doesn’t seem to be important, although it is usually higher on the first “hump.”
2. Rectangle (Also “Trading Range” or “Box”)
In the earlier discussion on trading ranges and sideways trends, we effectively described a rectangle pattern. It is one of the simplest of patterns, consisting of a resistance line above and a support line below (see Figure 15.2). Each resistance or support line must also be a trend line, which means that it must touch roughly the same price reversal at least twice. This added requirement is what separates it from a double top or bottom formation, which only requires that three price reversals occur. Prices are bounded by and oscillate between the two lines, and they eventually exit, or break out, in one direction or the other. The pattern can have a slight tilt upward or downward, but the trend lines defining the support and resistance zones are always parallel. It appears similar to a horizontal channel. It often has false or premature breakouts, neither of which is predictive of the eventual breakout direction.

Box 15.4 F alse and Premature Break outs
These breakouts are not exits from a formation but instead are minor breakouts above or below breakout levels that quickly return into the formation. They can occur at support and resistance levels as well as at trend lines. A “false” breakout is one that breaks out in the direction opposite from the direction of the final breakout, and a “premature” breakout is one that breaks in the same direction as the eventual exit breakout. In retrospect, these breakouts can have predictive value, but at the time either occurs, it is almost impossible to tell what type it is. When they occur frequently, they warn that a strict breakout discipline must be used to avoid triggering action before the actual exit breakout.
Within the rectangle formation, prices do not necessarily always reach the two zones but may fall short (a “shortfall” or “partial”). Sometimes this is a warning as to the direction of the eventual breakout. As an example, when well along the way of the formation of a rectangle, prices begin to reverse before declining all the way to the underlying support zone; buyers are getting a little more anxious and the odds increase for a breakout upward. Bulkowski reported that such a shortfall within the latter stages of the pattern is accurate 60% to 90% of the time in predicting the direction of eventual breakout depending on the breakout direction. More than half the time, prices throw back or pull back to the breakout zone, providing another action point but one with less profit potential. Edwards and Magee estimated that about 40% of the time, a pullback or throwback would occur. When the breakout occurs on a gap, the odds decrease that a retracement will occur.
Volume is often an important factor in any formation. In the rectangle pattern, however, a rising or declining volume trend within the pattern has little or no effect on the results after the breakout, although declining volume is more common. Results increase, however, when volume increases on the breakout itself.
Depending on the rectangle entry and exit (that is, whether it is a reversal or continuation pattern), the failure to reach 5% was between 9% and 16%. The worst was the declining continuation pattern (entry from above, exit down). Bulkowski ranked the overall performance of rectangles in the middle of the classical pattern pack.
Box 15.5 Trading Rectangles
Edwards and Magee claimed that rectangles are more often continuation patterns, but as a reversal pattern, they occur more frequently at bottoms. This is likely why Bulkowski mostly found upward breakout rectangle patterns. An upward breakout, however, should never be assumed. Indeed, two out of three rectangles are continuation patterns, and the initial expected direction of the breakout should be in line with the previous trend.
Rectangles have the bad habit of producing false breakouts. Indeed, more than 75% of early breakouts are false. This is a large enough figure to hint as to the eventual final breakout direction, but it requires close breakout and stop discipline. Once the final breakout has occurred, the failure rate is very low. These failures are called busted rectangles and occur if the breakout fails to gain at least 10% before returning to the rectangle and breaking out in the opposite direction. Upward initial breakouts bust 22% of the time, and downward initial breakouts bust 42% of the time. Thus, it pays to be sure that the breakout is real. Another hint is the existence of shortfalls. Shortfalls occur later in the formation and can anticipate the breakout. Use a method similar to that shown in Chapter 13, “Breakouts, Stops, and Retracements,” on anticipating breakouts, and keep a close protective stop. The volume trend during the formation of the pattern gives no hint as to the breakout direction and has only a minor effect on performance.
Some traders will trade within a rectangle, buying at the support level and selling at the resistance level. This is not recommended, however, unless the rectangle is particularly wide from top to bottom. Trading has many costs inherent in acting on the buys and sells. The obvious costs are commissions, slippage, and width of the spread. Additionally, when trading within two bounds, the bounds are not exact, nor will a trade be executed exactly at the bound. Thus, sell orders must be placed a certain distance, a specified filter, below a resistance zone, and buy orders a certain distance above a support zone. To be able to absorb these costs and price filters, the trader is limited to rectangles that are sufficiently high, from support to resistance. One who attempts this kind of trading must be watching the price action incessantly and be ready to scalp the few points in between the bounds and filters in an instant. Most traders and investors are unable to do this.
A target can be calculated by adding the height of the rectangle formation to the breakout price. According to Bulkowski, in rectangles, the upward target is reached or exceeded 91%— 93% of the time, and in downward breakouts, the target is reached or exceeded 65%-77% of the time. The difference in percentages is based on the entry, whether upward or downward, but in all cases, the target is a relatively accurate figure and can be used for risk/reward calculations.
3. Triple Top and Triple Bottom
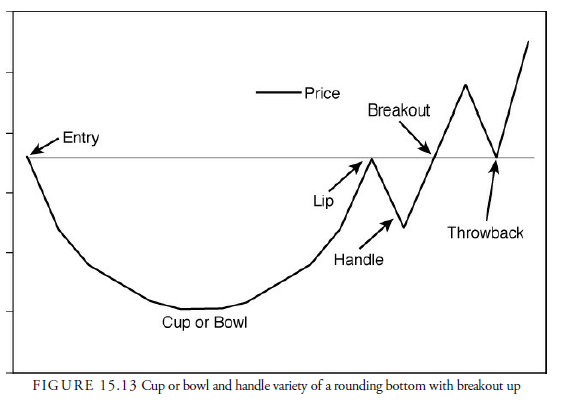
The triple top and bottom formation is just a rectangle with the number of touches to the support or resistance line being three. It is, thus, more specific than the rectangle and is less common. Each peak in the top should be at the same level and have roughly the same shape. The middle peak can be slightly lower than the other two. As in the double formations, confirmation only comes with a price breakout below the two bottoms. Pullbacks are common (63% of the time) and diminish the breakout performance. Tops only project 40% of the formation width below the breakout level but reach the projection within the first two weeks. Figure 15.3 shows a triple top with a breakout down, and Figure 15.4 shows a triple bottom with a breakout up. As you can see, they are the mirror image of each other. Sometimes in a triple bottom, the second peak is slightly higher than the first. This is favorable, and the breakout is the line between the two peaks. The patterns are rare and usually depend on the underlying market trend. They rank in the top third of classic patterns. Their failure rates very low (10% for bottoms, 4% for tops).


4. Standard Triangles
The rectangle pattern is bounded by parallel lines. If the same general pattern has nonparallel boundary lines such that when extended into the future they cross each other, the formation is a triangle pattern. Triangles can be the result of an upward-sloping lower bound or a downward-sloping upward bound. Thus, there are a number of possible combinations of the two lines.
In this section, we look only at the standard triangle patterns. In these triangles, the point at which the two lines extend and cross over each other is called the apex or the cradle, and the distance between the first high reversal point and the first low reversal point within the triangle is called the base.
When the lower bound is a horizontal support zone and the upper is a downward slanting trend line, it is called a descending triangle. When the lower trend line is rising and the upper bound is a horizontal resistance zone, it is called an ascending triangle. When the upper bound is declining and the lower bound is rising, it is called a symmetrical triangle. When both the upper bound and lower bound are slanting in the same direction and converging, it is called a wedge, and when the two lines are diverging regardless of slope, a reverse triangle, it is called a broadening pattern. When we combine a broadening pattern with a triangle, usually a symmetrical triangle, we get what is called a diamo nd pattern.
5. Descending Triangle
Figure 15.5 shows a descending triangle with a breakout down. Its bounds are a lower horizontal support line and a declining upper trend line; price should touch each line at least twice and should generally “fill” the triangle’s space. It can be entered from any direction. The breakout is more common to the downside (64%), but the upward breakout is more reliable and profitable (47% to 16% average gain). This formation can be stretched high and wide and is sometimes difficult to recognize. The trend lines defining its boundaries are almost never exact and are loaded with false intrabar breakouts. A strict breakout strategy is required, therefore, as we discussed in Chapter 13. However, prices often explode out of it and produce sizable gains. It can also be wild and guarantee an exciting ride. It will break out and run, break out and pull back to its trend line, break out and pull back to its cradle, or break back through the cradle, create a sizable trap, and then reverse back in its original breakout direction and run. In other words, when you enter on a breakout from a descending triangle, the subsequent action must be watched carefully.

Upward breakouts on gaps add considerably to performance and are definitely something to look for. On downward breaks, gaps seem to have little effect. Average breakout distance from the base to the cradle is 64%, most powerful at 80%. Entering from below and upward sloping volume equals better performance.
Figure 15.6 pictures a descending triangle with a breakout up. The typical pattern shows declining volume throughout its formation. However, increasing volume during the formation of an upward breaking descending triangle, although less frequent, is more favorable than declining volume. This contradicts the conventional opinion that advancing volume negates the pattern and represents a reason for screening it out for consideration. In the downward breakouts, declining volume during the pattern formation helps postbreakout performance only slightly. The amount of volume traded on the actual upward breakouts has little effect on the postperformance, but in downward breakouts, an increase on the breakout helps performance slightly. In many ways, the upward breaking descending triangle is similar to a failed head-and-shoulders top.

6. Ascending Triangle
A horizontal upper bound of resistance combined with an upward sloping lower bound of support defines an ascending triangle (shown in Figure 15.7 with a breakout down). The characteristics in this pattern are just as erratic as in descending triangles—lots of action up and down. Breakout points must be chosen carefully because of the pattern’s nature to have many small false breakouts, and declining volume is common but not necessary. Upward breakouts occur 77% of the time, and breakouts happen roughly 61% of the distance (time) from the base to the cradle. The overall performance rank is roughly in the middle of all patterns, with a little more favorable for downward breakouts. Failure rates are between 11% and 13% depending on breakout direction. This is about average.

7. Symmetrical Triangle (Also “Coil” or “Isosceles Triangle”)
When the upper bound is downward sloping and the lower bound is upward sloping, a symmetrical triangle is formed (see Figure 15.8). The term symmetrical gives the impression that both lines should have the same angle but in different directions. However, the slope of the two boundaries being formed at congruent angles is not a requirement. Thus, “symmetrical” is not an accurate description but is the term most commonly in use for this pattern. The less commonly used term coil is often a more accurate description.

Like the other standard triangles, the prices must touch each border trend line at least twice and meanwhile cover the area of the triangle with price action. Volume usually trends downward during the pattern formation (86% of the time), and the breakout is usually upward (54% of the time). Symmetrical triangles have many false breakouts and must be watched carefully. A strict breakout system must be used that allows for such false moves. The breakout commonly occurs between 73% and 75% of the length of the triangle from base to cradle. This formation does not occur as frequently as the descending or ascending triangle, but it is still common relative to other chart patterns. Throwbacks and pullbacks occur 37% and 59% of the time, respectively, and, as in most patterns, when they occur, they detract from eventual performance. This implies that for actual investment or trading, the initial breakout should be acted upon, and if a pullback or throwback occurs, the protective stop should be tightened. It does not imply that a pullback or throwback should be ignored, but that instead, performance expectations should be less than if no pullback or throwback had occurred. Gap breakouts do not seem to affect the performance on the upside but do give a few extra percentage points on the downside. Increasing volume trend seems to be associated with better results once the breakout occurs. High volume on breakouts, both upward and downward, adds considerably to the performance of the formation and is something to look for. Overall performance is slightly below the mean for classic patterns.
Box 15.6 Trading Triangles
The ideal situation for trading triangles is a definite breakout, a high trading range within the triangle, an upward-sloping volume trend during the formation of the triangle, and especially a gap on the breakout. These patterns seem to work better with small-cap stocks in a rising market.
Triangles are plentiful. For example, the upward failure of a head-and-shoulders top before any break through the neckline is a form of an upward-breaking descending triangle. This is one likely reason that such head-and-shoulder top pattern failures are so profitable.
Although triangles are plentiful, their patterns suffer from many false and premature breakouts. This requires that a very strict breakout rule be used—either a wide filter or a number of closes outside the breakout zone. It also requires a close protective stop at the breakout level in case the breakout is false. Once these defensive levels have been exceeded and price is on its way, the trader can relax for a little while because the failure rate after a legitimate breakout is relatively low. Trailing stops should then be placed at each preceding minor reversal.
There are many old rules about when a breakout should occur within a triangle. Some, such as Murphy, say that one-half to two-thirds the distance from the base to the apex is appropriate. Others, such as Edwards and Magee, use the one-half to three-quarters rule. In fact, the breakout can occur at any time once the triangle has been defined by legitimate upper and lower converging trend lines. Edwards and Magee do point out that the longer the distance, the more likely the performance will be less, but this also is not necessarily true. The highest percentage performance does come from breakouts generally around 60%-70% of the distance from the base to the cradle. However, in symmetrical triangles, the best performance comes from late breakouts in the 73%-75% distance. Thus, the old rules are partially correct but not strictly so.
Generally, the volume trend during the formation of a triangle declines, but in the case of an upward breaking descending triangle, an ascending triangle, and a downward breaking symmetrical triangle, an upward-sloping volume trend gives better results. Declining volume is not a reason to disregard the pattern, however. Volume on the breakout seems more desirable in symmetrical triangles, but it cannot hurt in others. Gaps are better predictors of performance in the upward-breaking descending triangle and the downward-breaking symmetrical triangle, but they are not necessary.
An initial target for these patterns is calculated by adding the base distance—the vertical distance between the initial upper and lower reversal point prices—to the price where the breakout occurred. In an upward-breaking descending triangle, for example, this target is reached better than 67% of the time. Other triangles have relatively the same success rate— higher in upward trends than in downward trends. This is why a wide trading range is preferred within the triangle—it suggests a higher target price on the breakout.
8. Broadening Patterns
A broadening pattern exists when we take the standard rectangle pattern and draw the bound lines diverging from each other into the future rather than converging as in a standard triangle. As pictured in Figure 15.9, the price range is increasing during the broadening pattern, as opposed to the narrowing price range that is associated with the standard triangle patterns. The terms megaphone, funnel, reverse triangle, and inverted triangle all refer to broadening patterns. The broadening pattern also comes in many variations. One is similar to ascending and descending triangles in that one of the bounds is horizontal. The other bound then slopes away from the horizontal line either above or below. A final variation is the broadening wedge. This pattern is similar to a wedge pattern (see Figure 15.9) except the bounds trend in the same direction but diverge instead of converge as in a wedge. None of these variations seems to have any above-average performance statistics except the ascending broadening wedge, which has both bounds rising and diverging. Upward breakouts in this pattern rank 6 out of 23 in Bulkowski’s scale and have failure rates at 2%, which is almost negligible.

Broadening formations are the least-useful patterns for a number of reasons. First, they are relatively rare in occurrence and are often difficult to identify. Second, and more important, they are difficult to profit from. Because the boundary trend lines are separating over time, the breakout lines are constantly moving away from each other. In an upward breaking broadening pattern, this means the upper breakout level is getting higher and higher along the upper trend line (refer to Figure 15.9). By getting higher and higher, not only is it using up much of any potential gain after a breakout, but it is moving farther from any realistic protective stop level, thus increasing the risk. Finally, the raw performance statistics show that performance of a broadening pattern is average at best, and its failure rate is above average. One of the most profitable patterns utilizing a broadening pattern, however, is when it is combined with a symmetrical triangle into a diamond top, which we discuss next.
9. Diamond Top
One of the less frequent but profitable patterns is the diamond (see Figure 15.10). It consists of a combination of a broadening pattern and a symmetrical triangle and usually occurs at the top of a sharp upward rise in prices. It is rare at price bottoms.

Because it combines two types of triangles, the diamond is the most difficult to observe. Remember that to establish a trend line, two extreme points that a line can be drawn between must be identified. In a standard broadening formation, the upper trend line slopes upward and must, therefore, have two peaks—the latter higher than the former. Likewise, the lower trend line must have two troughs—the latter lower than the former—and each line must be formed at the same time as the other. The first reversal point depends on the entry direction, of course, and because diamonds are mostly top formations, the entry direction is generally from below. This means that the first reversal point will be a peak. After that, the first trough will appear, then the next higher peak, and then the next lower trough. When trend lines have been drawn to connect these reversal points, we have a broadening formation. Now we must observe a symmetrical triangle immediately after the broadening formation to establish a diamond pattern. The trend lines in a symmetrical triangle converge, as in all standard triangles, and must have at least two peaks and troughs to establish each trend line. The first reversal peak and trough may be the last reversal points in the broadening formation or the next reversal points following the broadening formation. Often the trend lines in the symmetrical triangle will be parallel to the trend lines in the broadening pattern, but this is not a requirement.
Bulkowski’s figures show that around 58% of the time, the preceding price action in a diamond top was a steeply rising trend. When this occurs, the odds increase that the breakout from the diamond will be downward and will be equally as steep, and 82% of the time, it will retrace the entire prior rise. These figures are only valid for downward breakouts from a top, which occur 67% of the time. Upward breakouts from a diamond top have a poor performance history and should be avoided. Thus, action should only be taken once the pattern has been identified and the downward breakout has occurred.
Diamond bottoms have the same configuration as diamond tops and are the best patterns that Bulkowski ranks. They are number 1 in performance when they fail and break down (about 31% of the time). Even when they break upward, their ranking is 8 out of 23.
As in most patterns, volume usually declines (67% of the time) during its formation, but declining volume is not necessary. Indeed, rising volume is a plus for performance after the breakout.
Pullbacks are common in diamond patterns, occurring more than 53% of the time. These pullbacks tend to detract from performance when they occur but are not that significant. The best combination is when downward breakout occurs on below-average breakout volume and no pullback. The failure rate is relatively low at 4%—10%. These low numbers equate, to some extent, with risk. Combined with the above-average median return, these numbers suggest that, although rare, when a diamond top is identified, it has an aboveaverage chance of being profitable with minimum risk.
Box 15.7 Trading Diamonds
The diamond formation, once properly defined, tends to have a fast-moving price run on the breakout. Indeed, if the postbreakout price behavior is sluggish, the position should likely be closed or a close trailing stop placed near the current price. The price objective is usually the distance that the entry price traveled to reach the diamond. A steep entry is usually followed by a steep exit.
10. Wedge and Climax
A wedge pattern is a triangle pattern with both trend lines heading in the same direction. A rising wedge has both lines headed upward, with the lower bound rising more quickly than the upper bound, as pictured in Figure 15.11. The declining wedge has both lines headed downward, with the upward bound falling more quickly than the lower bound. The lines cross in the future, just as in a standard triangle, and the nomenclature for the crossover and height is the same.

Rather than the rectangle as the basis for this formation as it is with standard triangles, consider a channel (see Chapter 12). A channel is two parallel trend lines either rising or declining. In the earlier discussion of channels, we noted that when the channel line, drawn parallel to the trend line through the opposite set of reversal points, begins to slope toward the trend line, it suggests that players are becoming less enthusiastic with the trend line direction. For example, in an upward-sloping channel, the channel line above the trend line connecting the downward reversal points begins as a line parallel to the upward trend line. If a later rally within the channel fails to reach the channel line, the new channel line through the new downward reversal and the last downward reversal will have a lesser slope than the underlying trend line, and if projected into the future, it will eventually meet the trend line. This new configuration of channel and trend line is a rising wedge. It suggests in the example that sellers have become a little more anxious than before, and by implication, that the trend line will soon be broken. Indeed, the statistics bear this out. Almost all declining wedges (92%) break out upward, and most rising wedges (69%) break out to the downside (Bulkowski, 2010).
Wedges are one of a few patterns that can be consolidation patterns against the prevailing trend, consolidation patterns with the trend, or topping patterns, especially when accompanying a climax. They occur more often during consolidations but are more dramatic after a climax.
Let us look at rising wedges first. Rising wedges occur either during a long downward price trend or after an upward climax. The ones that occur during a downtrend appear as weak rallies against the trend. As mentioned previously, they invariably break again to the downside and continue the downtrend. Declining wedges are almost the same pattern and occur under similar circumstances, only in the opposite direction.
A market climax occurs when prices accelerate, as shown in Chapter 12. At these times, the underlying trend line is gradually adjusted at a steeper slope in line with the direction of prices. In an upward accelerated trend, the support reversal points occur at levels higher than the projected trend line and cause that trend line to be adjusted to a steeper slope. This can occur several times as prices accelerate upward. The climax itself usually comes on extremely high volume and a sharp reversal. It is discussed later in Chapter 17. After a climax has occurred and prices have settled down, invariably a “test” occurs that attempts to rally back through climax extreme peak. The pattern most often associated with the failure of that test—in other words, when the test fails to exceed the climax extreme or only exceeds by a small amount—is a rising wedge (refer to Figure 15.11). In the case of a climax low after a panic, the test wedge is the declining variety (see Figure 15.12).
At a climax peak, when the test is a rising wedge pattern, the odds are extremely high that the breakout will be downward. Because the emotion and commitment have been exhausted at the climax peak and are unable to return during the test, the downward break in the wedge pattern is the sign of a longer-term downward reversal. Thus, the wedge is a reversal pattern, even though it may not occur at the actual climax peak high.
Other rising wedges can occur as a consolidation during a sustained downward trend and occasionally will end at the top of a weakening upward trend. The latter we will see as a “fifth wave diagonal” in the discussion of Elliott Waves in Chapter 20, “Elliott, Fibonacci, and Gann.”
Because trend lines often converge in the same direction when a wedge is not present, Bulkowski requires that at least five reversal points be touched to qualify the pattern as a wedge. This means three points on one trend line and at least two on the other. Otherwise, the pattern is not accurately identified and may fail to show the results seen in actual wedge patterns.
Another characteristic of wedges, in both the consolidation and the reversal varieties, is declining volume during the formation of the wedge. Declining volume occurs in three-quarters of the formations, and when it does, the postperformance improves over those wedges with increasing volume. Breakout volume seems to be irrelevant to postperformance. Pullbacks and throwbacks have high odds of occurring and when present detract from subsequent performance.
The performance rank for wedges is in the lower quartile of all the other classic patterns, and its failure rate is considerably lower for upward breakouts (8%—11%) than for downward breakouts (15%—24%). The rising wedge with a downward breakout is the least reliable.
Box 15.8 Trading Wedges
It pays to wait for that breakout and to act immediately on it. In addition, because wedges have such a high percentage of breakouts in the direction opposite from the wedge direction, the direction of breakout is clear once the wedge is forming. A rising wedge invariably will break downward, and a declining wedge upward. Whenever a climax has occurred, whether up or down, look for a wedge to form on the test. This is one of the most profitable patterns of all. Just be sure that a wedge as described previously is valid before you take any action.
Source: Kirkpatrick II Charles D., Dahlquist Julie R. (2015), Technical Analysis: The Complete Resource for Financial Market Technicians, FT Press; 3rd edition.
Normally I do not read article on blogs, but I would like to say that this write-up very forced me to try and do so! Your writing style has been surprised me. Thanks, quite nice article.