Marketing cost analysis examines sales volume and selling expenses to determine the relative profitability of particular aspects of sales operations. The first step in marketing cost analysis is sales analysis by territories, sales personnel, products, class of account, size of order, marketing channels, and other categories. Having broken down sales volume, for instance, by sales territories, the next step is to break down and assign selling expenses by sales territories. The outcome indicates relative profitability of the sales territories. Marketing cost analysis searches for ways to improve profit performance through exposing relative strengths and weaknesses.
1. Purposes of Marketing Cost Analysis
Marketing cost analysis determines the relative profitability of particular aspects of sales operations. In a given case, the specific objective is to suggest answers to questions such as: Which sales territories are piofitable and which are unprofitable? What are the profit contributions of individual sales personnel? What is the profitability of the different products? What is the minimum size of a profitable account? How small can an order be and still be profitable? Which marketing channels provide the most profit for a given sales volume?
Marketing cost analyses only suggest the answers to these and similar questions. They indicate aspects possibly requiring managerial action, but not the nature of the action. Answers to more complex questions that require cross-analysis of expense allocations, are also suggested. If the expenses of selling different products, for instance, are cross-analyzed with the expenses incurred by individual sales personnel, insights are gained on how sales time should be allocated among products. But, here again, a complete answer to the question (on how to improve sales time allocation among products) requires consideration of other factors—among them, sales potentials for each product in, each sales territory.
2. Marketing Cost Analysis Techniques
Classifying selling expenses. Marketing cost analysis requires the classification of selling expenses as either separable (direct) or common (indirect). A separable expense is one traceable to individual sales personnel, sales territories, customers, marketing channels, products, or the like. A common expense is one that is not traceable to specific sales personnel, sales territories, customers, marketing channels, products, or the like.
Whether a given expense is a separable or common expense may depend on company policies or aspects of the operation under study. If sales personnel are paid salaries, for example, the outlay for salaries is a common expense as far as selling individual products is concerned. But if sales personnel are paid commissions, sales commissions are a separable expense of selling individual products and of selling particular categories of account or individual customers.
Converting accounting expense data to activity expense groups. Conventional accounting systems record expenses according to their immediate purpose. For instance, typical account titles include sales salaries, sales commissions, sales travel expense, branch sales office rent, advertising expense, general selling expense, general and administrative expenses, and bad-debt expense. In marketing cost analysis, accounting expense data are converted into activity expense groups, for instance, all the expenses related to field sales operations are grouped together (including sales salaries, sales commissions, sales travel expense, and branch sales office rent) to determine total expense for this activity.
Bases for allocating common expenses. Selection of bases for allocating common expenses is troublesome. In contrast to the analysis of production costs, where a single allocation basis, such as number of machine hours, is used for allocating all manufacturing expenses, some forms of marketing cost analysis require the allocation of selling and marketing expenses on several bases.
Allocation bases are factors that measure variability in the activities for which specific expenses are incurred. Allocation bases permit logical assignment of portions of common expense items to particular aspects of sales operations. Some expenses, such as credit and collection expenses, can be allocated according to a logical basis in any type of marketing cost analysis. But other expenses, such as sales salaries, can be allocated to sales territories or to customers but not usually to products, unless available data show the allocation of sales time among different products.
For most marketing cost analysis, no attempt is made to allocate all common expenses; only those that can be allocated on logical bases. Marketing cost analysis determine relative profitability, not net profitability, of particular aspects of sales operations. There is no need to allocate all common costs.
Contribution margin. Because marketing cost analysis focus upon separable expenses and those common expenses can be allocated on logical bases. Relative profitability is measured as a contribution margin. By definition, contribution margin = net sales – cost of goods sold – (separable expenses + common expenses allocatable on logical bases). Put differently, contribution margin is the dollar amount available to cover unallocated common expenses and profit (if any).
3. Marketing Cost Analysis—An Illustration
Bhanton Cosmetics prepared monthly and annual “Salesperson Performance Reports” for each of its twelve salespersons. The annual performance reports for two salespersons—Nandini Nim and Shraddha Hanks— are shown in Figure 20.5. Bhanton Cosmetics classified its twelve sales territories into three types (A, B, and C), according to characteristics such as travel required, customer demographics, and product prices. A territory budget was formulated for each of the three types of territories. Nandini and Shraddha were assigned to type A territories.
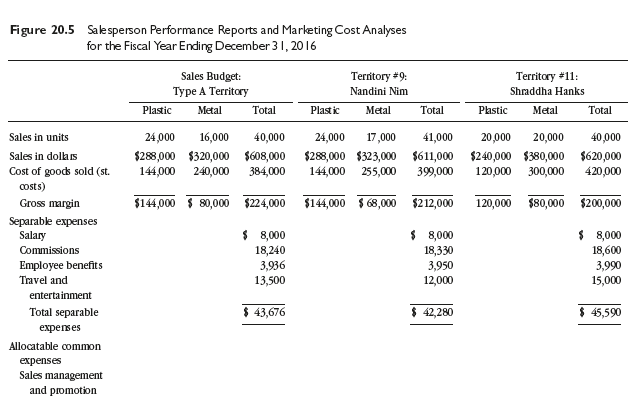
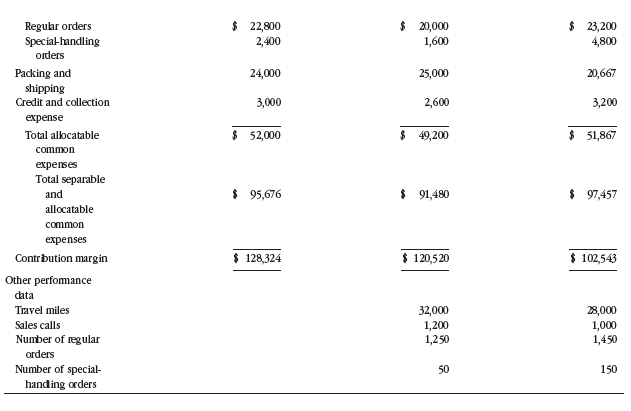
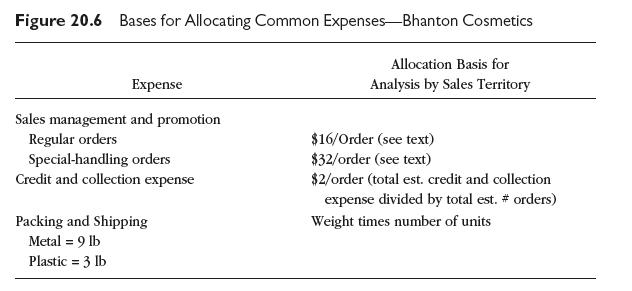
The Salesperson Performance Report had two purposes: (1) to compare the salesperson’s performance with the budgeted performance, and (2) to show the salesperson’s contribution margin. All expenses that could be associated with the salesperson’s effort to generate and produce sales were included. Sales management and promotion expenses (including salaries) were charged to the salesperson according to the number of regular and special-handling orders sales personnel wrote. Special-handling orders required approximately twice as much administrative effort as regular orders; consequently, the charge for specialhandling orders was double the charge for regular orders ($32 versus $16). The 2016 rate was determined by dividing the amount budgeted for sales management salaries and sales promotion costs ($320,000) by the estimated total orders (regular, 18,000; special-handling, 1,000) weighted by the amount of administrative effort. Special-handling orders were approximately 5 percent of the total orders handled. The bases for allocating allocatable common expenses are shown in Figure 20.6.
Who is the better salesperson—Nandini or Shraddha? The marketing cost analysis (Figure 20.5) shows that the contribution margin for Nandini is over $18,000 higher than that for Shraddha, neither reaching the budgeted contribution margin (evidently because the realized price for metal units was $19/unit rather than the budgeted $20/unit). If the budgeted price for metal units is adjusted to $19, Nandini’s contribution margin exceeds that budgeted by over $8,000 while Shraddha’s falls short by nearly $10,000.
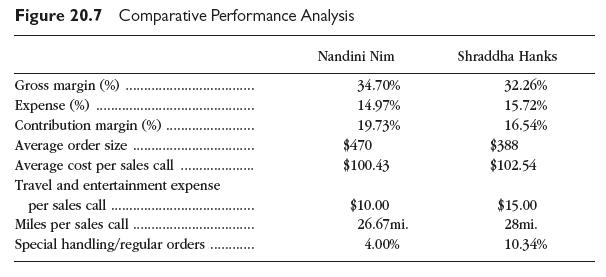
What else can be said about the comparative performances of Nandini and Shraddha? Figure 20.7 shows eight calculations of the sorts that interest sales managers. The gross margin, expense, and contribution margin percentages, all derived from the territory sales analyses, again demonstrate Nandini’s superiority over Shraddha. Nandini, too, sells larger orders per sales call at a lower cost per call and with less travel and entertainment expenses. Nandini travels fewer miles for each sales call (this could imply room for improved route planning by Shraddha). Nandini generates a smaller proportion of specialhandling orders than Sharddha does—special-handling orders require more managerial effort than do regular orders. These calculations and comparisons illustrate how to enrich the findings of marketing cost analyses.
Source: Richard R. Still, Edward W. Cundliff, Normal A. P Govoni, Sandeep Puri (2017), Sales and Distribution Management: Decisions, Strategies, and Cases, Pearson; Sixth edition.
Hello. magnificent job. I did not imagine this. This is a remarkable story. Thanks!
Great line up. We will be linking to this great article on our site. Keep up the good writing.