Sales analysis is a detailed study of sales volume performance to detect strengths and weaknesses. If sales management depends solely on summary sales data, it will not be possible to evaluate its own activities and those of the sales force. The fact that sales increased by 2 percent over last year but profit decreased by 1 percent would be a cause for concern but of no help in determining how to reverse the profit decline. Sales analysis provides additional information, for example, that the increased sales volume came from products carrying a lower-than-average gross margin.
Through sales analyses, management seeks insights on strong and weak territories, high-volume and low-volume products, and the types of customers providing satisfactory and unsatisfactory sales volume. Sales analysis uncovers details that otherwise lie hidden in the sales records. It provides information that management needs to allocate sales efforts effectively.
1. Allocation of Sales Effort
In most businesses, a small percentage of the territories, customers, products, or orders brings in a high percentage of the sales; conversely, a large percentage of the territories, customers, products, or orders brings in a low percentage of the sales. A sales executive for a carpet manufacturing firm, for example, found that 80 percent of the customers accounted for only 15 percent of the sales. Comparable situations exist in most companies. These are examples of the “iceberg principle”—only a small part of the total situation is above the surface and known while the submerged part is beneath the surface and unknown. Sales analysis detects such situations, alerting management to opportunities for improving operations.
This type of sales patterns does not always mean unprofitable operations, but they frequently result in profits lower than necessary. Why? Simply because sales efforts, and hence, selling expenses are ordinarily divided on the basis of customers, territories, orders, and so forth, rather than on the basis of sales potentials or actual sales. It usually costs as much to maintain sales personnel in poor territories as in good ones, almost as much to promote a slow-selling product as one that sells “like hotcakes.” It costs as much to have sales personnel call on customers who give small orders as on those who place large orders. Commonly, a large proportion of the total spending for personal-selling efforts brings in a small proportion of the total sales and profits. Sales analysis detects these situations.
2. Data for Sales Analysis
Companies vary in the data they have available for sales analysis. At one extreme, some have no data other than the accounting system records as sales are made, and, of course, copies of sales invoices. At the opposite extreme, some maintain detailed sales records and have data readily available for use in making all types of analyses.
The original sources of data for sales analysis are the sales invoices. In a company with a good information system, detailed data from sales invoices is captured and analyzed with different software applications. The information on each transaction identifies the customer (name, geographical location, and so on) the salesperson (name, territory, and so forth) and includes such sales data as order date, products sold and quantities, price per unit, total dollar sales per product, and total order amount. With information stored in this detail, sales analyses are performed quickly and at low cost.
3. Illustrative Sales Analysis
The southeastern sales manager of a carpet manufacturing firm has just learned that the region did not reach its quota for the second quarter. The region did not miss by far, achieving nearly 97 percent of its quota. However, the sales manager would like more details: Where did we fall down? Are we universally missing the target? Are there any bright spots?
Consequently, the sales manager asks for a sales analysis of the southeastern region by sales areas. Figure 20.1 shows this analysis. The good news is that Atlanta and Jacksonville exceeded their quotas. The bad news is that Charlotte and New Orleans missed their targets by considerable margins.
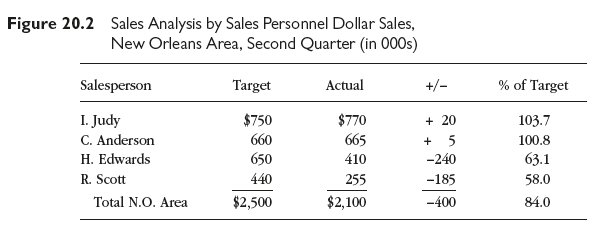
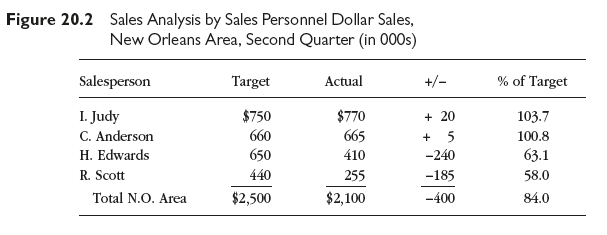
The sales manager wants more details about the Charlotte and New Orleans situations. It is decided to probe the New Orleans sales area first, as it had a sales deficit of $400,000, greater than the deficit for the entire region ($370,000). The first sales analysis furnished details on the four members of the sales force assigned to the New Orleans area (see Figure 20.2). Edwards and Scott are responsible for the area’s poor quota performance.
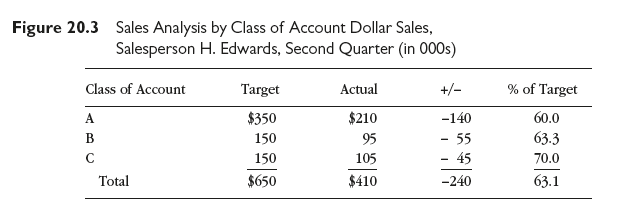
Edwards missed the mark by the largest amount (though Edwards’ performance against quota was better the Scott’s), so the sales manager next asks for a breakdown (sales analysis) of Edwards’ sales by class of account (A = large accounts, B = medium-sized accounts, and C = small accounts). Figure 20.3 shows this sales analysis. Edwards’ sales performance by class of account indicates the most success in selling smaller accounts, but across the board it has been below par.
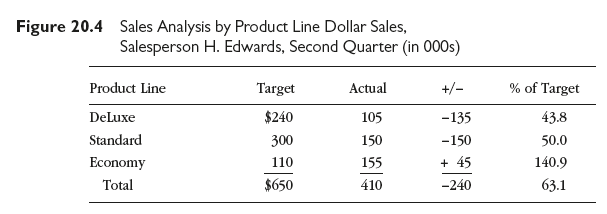
The sales manager next asks for a sales analysis of Edwards’ sales by product line. Figure 20.4 shows this analysis. Edwards has poor performance in the DeLuxe and Standard lines, but goes over quota in the Economy line.
4. Purposes of Sales Analyses
Sales analysis detects sales strengths and weaknesses, and each type of sales analysis sheds light on a different aspect. Analysis of sales territories answers how much is being sold where. Analysis of sales by products answers how much of what is being sold. Analysis of sales by customers answers who is buying how much. All sales analyses relate to how much is being sold, but each answers the question in a different way. Sales analyses identify different aspects of sales strengths and weaknesses, but they cannot explain why strengths and weaknesses exist. Answering the “why” question is up to sales management.
Sales analysis answered four of the sales manager’s questions. First, it revealed sales areas with good (Atlanta and Jacksonville) and poor (Charlotte and New Orleans) performances. Second, it showed that salespersons Judy and Anderson were above quota, while Edwards and Scott were below. Third, it indicated that Edwards’ performance improved as accounts got smaller, but was unsatisfactory with all sizes of accounts. Fourth, it showed that Edwards’ performance was unsatisfactory in selling the DeLuxe and Standard lines and above par in selling the Economy line. The sales manager, in other words, learned where sales were weak and strong, which salespersons were performing above or below quota, which classes of accounts were buying, and which products were being sold. No “why” questions were answered. It is up to management to explain why, and this could lead to reappraisals of the sales efforts, quotas relative to potentials, selling against the competition, which accounts buy which product lines and why, training salespersons to sell balanced sales mixtures, sales compensation, and sales support (for example, local advertising, sales promotional pieces, and dealer incentive campaigns).
Source: Richard R. Still, Edward W. Cundliff, Normal A. P Govoni, Sandeep Puri (2017), Sales and Distribution Management: Decisions, Strategies, and Cases, Pearson; Sixth edition.
I carry on listening to the news bulletin speak about getting free online grant applications so I have been looking around for the most excellent site to get one. Could you tell me please, where could i acquire some?