We commonly talk of ‘experimenting’ with things – whether it is a new multi-function mobile phone or an elaborate recipe culled from a magazine – by which we mean trying something out and seeing what happens, what results we get. Formal experiments lie at the heart of scientific research and there are two main kinds: theory testing (if this theory is correct we ought to get this result) and significant effects testing (empirical research) which is quite close to our commonsense usage above.
Consider, for example, medical researchers evaluating a new drug. A recipe that doesn’t work is of little importance; a drug that doesn’t do what it is supposed to do can lead to a waste of resources and even damage human health – hence the controlled conditions and elaborate safeguards involved in such research. We shall take lessons from the careful procedures of medical scientists.
1. Formal experiments
Let us assume that a new drug for treating hypertension (high blood pressure) is being tested.
The scientists would first ask themselves: does the drug have an independent effect on blood pressure (itself a variable phenomenon)? The standard procedure is to use an experimental group (who get the drug) and a control group (who get an inert placebo). They might also employ multiple experimental groups trying out the drug at different dosage levels.
Obviously they would try out the drug on people who suffer from hypertension, and there are levels of this – mild, moderate and severe. However these human guinea pigs are selected, the medical scientists still have to ensure that the two groups to be compared are equivalent. This is done by allocadng patients randomly to each group – note that this is a technical procedure designed to ensure that there is no systematic bias in selecting patients.
The patients are tested before and after the (real or placebo) drug treatment, and here great care has to be taken to ensure:
- no patients know which they have been given
- the doctors administering the ‘drug’ do not know either
- the medical researchers who measure blood pressure before and after the administration don’t know to which group the patients belong.
This kind of triple-blind study effectively removes the bias that comes from expectation (by the patients, but also the doctors and researchers). Of course that level or kind of rigour won’t be needed in what is to be described here; but it points the lesson that we should be alert to sources of bias in our findings.
2. A practical example
We live in a world of mass-produced, designed objects. In the previous chapter we stressed the need to observe, nat- uralistically, the fine detail of daily living, where people have to deal with the, usually minor, challenges of routine practicalities. That can be done systematically but it does not amount to an ‘experiment’. In a practical experiment we construct a setting and then observe how different groups (by age or whatever) cope with it: we manipulate or control what we observe.
Designers work to a particular brief and with a particular purpose in mind. A familiar example is that of safety botde caps – for medicines and potentially toxic household fluids such as bleach, disinfectant and paint stripper. These have been a significant source of harm (sometimes fatal) to young children. Most serious accidents to this age group occur in the home because that is where they spend most of their time. The contribution of design to child safety is an important one, with many successes.
Safety bottle caps, so designed that they require a (presumably) adult level of understanding and dexterity to unscrew them, are a good example. But as with most ‘solutions’ they can create problems in their turn. A characteristic design is one where you have to squeeze the top at certain points, push down and then turn. This creates difficulties for older adults who have arthritic hands or muscular weakness; but in truth we all have some difficulty with this type of cap. And it can lead to other kinds of accidents – for example to an older person trying to lever the top off.
So we have two problems that require a design solution: botde caps which can’t easily be opened by young children but can be opened without difficulty by adults with mild disabilities. How could a design which seeks to overcome these conflicting problems be evaluated?
The experimental setting
We could try out the new design with three groups:
- children aged 3-5 (a particularly vulnerable age)
- bodily able adults aged 25-35 years
- adults over 65 with the kind of mild manual disabilities outlined above.
The researcher would give each of them, individually, the ‘test’ bottle simply saying: See if you can get this cap off (in the case of the children first screwing the cap on while they watch so that they are ‘cued in’).
Their attempts would have to be videoed because the designer/researcher would need to analyse each attempt retrospectively. It would also be necessary to time each individual because, even if successful, any delay might be critical to safety in young children (as many parents can testify); and conversely might try the patience of older people struggling to remove the cap.
The results of such an experiment can be surprising. For example, we might find that the new design defeats the attempts of all the children, half of the older group with manual disabilities, but also some of the physically able younger adult group. That would be interesting in its own right. But the most important element is what lies behind the results and it is here that the video analysis makes its contribution, allowing repeated observation of the same sequence as necessary, showing how the individuals attempted to remove the cap and what seemed to be the problem elements.
A short video interview could also be used to supplement the observation sequence, asking (the adults) what they found difficult about the operation of the cap.
What we have described comes under the heading of evaluative research and it is here that systematic ‘experimental’ observation is particularly appropriate. Does it work in the way intended? And what lessons can be learned from a study of how the individuals concerned tried to operate the safety cap (or whatever was being tried out)?
Using comparison groups
In the previous, hypothetical, experiment we proposed three different age/ability groups, giving them all the same task.
Another approach would be to have groups made up of approximately the same kind of people (loosely matched in terms of age, gender, ability and experience) and give them different versions of the same task, for example evaluating different approaches to software training:
- a group that watched a ‘live’ demonstration
- a group that studied the manual
- a group that had access to a video demonstration and a ‘key points’ printed summary.
Note that this is not a tightly controlled conventional experiment seeking significant differences between the groups on some pre- and post-test performance criterion. Rather the different methods would be compared in terms of:
- the kind of questions people asked in training
- the difficulties they experienced in their subsequent use of the software, perhaps against a performance checklist.
We are not out to demonstrate the superiority of Method A over Method B or C; in real life you learn something from observing each method.
So the emphasis may not be quantitative but it is systematic. We are after insight into the practicalities of learning a procedure. There will be hints and clues from the successes and difficulties of those using the software; and we can ask them what they found useful or not, as the case may be, in the form of training they were given.
Although the comparisons are carefully specified and the whole procedure systematically organized and analysed, it is a long way from a traditional experiment where you would have random allocation of subjects to groups, exact equivalence of training times, pre- and post-tests on a precisely specified performance test (of the outcome or dependent variable) and so on.
If experimentally-minded social scientists see this as the thin end of the wedge, they should be warned that our exposition is about to get wider by taking ‘experiments’ literally outside into a real-world setting.
3. Devising signage systems
A well-designed environmental setting like a road layout or piece of equipment almost speaks for itself in the sense that without specific instructions or even too much thought you know what to do. Ambiguous road layouts or control panels on a car are at least irritating, at worst can lead to accidents. Both employ what are known as signage systems to supplement the guidance that comes from the overall perception of the design layout. Such systems almost amount to an international language and for road signs, in the European Union at least, are regulated to that end.
Devising signs that are easily and unambiguously read is an industry in its own right. The most easily read signs (like primitive languages) are pictographic. For example on a video or DVD player we would all recognize:
<<<< = rewind/retum
>>>> = fast forward
Note that the use of multiple arrow heads seems to connote movement; you get something similar in the kind of road sign that emphasizes you are travelling to the left or right (or should be!).
On amplifying equipment this kind of visual movement may be incorporated to show an increase in volume, especially if it has a ‘growing’ gradient as you press the button. These pictographic visual clues are fairly straightforward but there is a range of more abstract signs; and first we need to clarify these different ‘written’ language systems.
Types of written language
Pictographic signs – where simple schematic picture-signs are employed – are the most basic and straightforward: for example the signs for wheelchair access to lavatories, those for men and women, or baby-changing facilities. Pictographic languages are the most primitive because they are the least capable of representing more abstract and complex language functions such as the expression of thought. In western cultures we mostly have an alphabetic language system – where the written symbols are linked reasonably directly to the way in which the ‘signs’ are said.
But the third main type of written language system is logographic: that is where the sign represents a concept, which may be abstract in character. The written Chinese language is logographic – it conveys meaning but not how the signs are spoken – thus the two main spoken Chinese languages, Mandarin and Cantonese, are mutually incomprehensible, though the speakers can communicate in writing. This may sound strange but we have a parallel in our own culture in the system of numerals and mathematical symbols; these are almost universal but a Frenchman would probably not understand a Norwegian who ‘spoke’ a formula such as 3(52 )/10.54 – yet both could read it (although to complicate the example most Europeans use a comma to indicate a decimal point). Many established signage systems are ‘logographic’, i.e. universal in that sense, and they are constantly developing. And product marketing depends heavily on instantly identified logograms – hence logos – from the Nike ‘swoosh’ to the controversial design for the 2012 Olympics.
4. Testing signage systems
It would be wrong to assume that pictographic signs are always easy and unambiguous to read; also, some of them are ‘in between’ – for example the skull-and-crossbones sign to indicate danger (why not a graveyard?). Here the picture represents a concept; but there is a limit to how far pictures can depict the abstract. The relationship between sign and symbol, signifier and signified, is too deep a theoretical issue for us to consider here. It is sufficient to say that some ‘abstract’ symbols are more easily ‘read’ than others, whether they are conventional or not. Consider what these examples might mean (some more established than others).
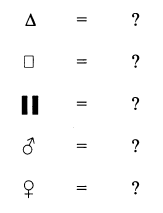
The last two have a well-established signification of gender – but are you entirely sure which is which? And why} (Answers are given at the end of the chapter.)
Signs in context
Signs, like words, are supported in their meaning by the context in which they appear and these contextual factors all have a bearing on whether signs are ‘seen’ as well as ‘read’. You can, of course, test signs as a paper exercise – as above, i.e. what do you think these might mean? But a more adequate test is the behavioural response of people to the sign.
This needs to be spelled out because it involves juggling several variables in an actual live setting – too complex and difficult to define for a tightly controlled experiment. Both structured and semi-structured observation have a role here, and perhaps interviewing as well. The experimental dimension is the manipulation of the contextual factory we would previously have found out whether people read the signs correctly once they have seen/noticed them. So the experiment is about presentational and contextual factors, for example:
- size and colour contrast of signs
- precise location (proximity to what is being signed, ‘guidance’ from the layout)
- association with/or distinction from other signs (relevant linking, avoiding confusion or ambiguity)
- height at which signs are placed
- ‘confusion’ factors – the visual busyness of the surroundings.
If signs on equipment are being tested then mock-ups are appropriate but here again other factors come into play (sequence, visibility, size, and so on), all of these being relevant to how, and whether, the signs are read correctly. For example, if on a piece of equipment there is a sequence in operating the controls – whatever signs are used – the signs will be more easily ‘read’ if they are placed in a left-to- right arrangement in the required order.
In researching these situations video recordings may be useful: the direction of attention, hesitation and uncertainty displayed in relation to public space signage; the number of correct operations of keys etc. on technological equipment. In the latter case the use (and design) of product manuals is an additional dimension. In general it is unaided responses that are the primary data. The more help you need, the less successful the overall design and sign system employed.
And in all cases, the user dimension is a factor. Different groups – by age, ability, experience – are going to respond differently to ‘tasks’ of this kind. In the case of specified usage this may not be relevant. But, to repeat a point made earlier: something that works well is that which presents fewer problems for everyone.
Source: Gillham Bill (2008), Observation Techniques: Structured to Unstructured, Continuum; Illustrated edition.
9 Aug 2021
9 Aug 2021
9 Aug 2021
9 Aug 2021
9 Aug 2021
9 Aug 2021