As with CAPI and CATI, electronic formatting of the questionnaire brings opportunities to replicate and improve on pen and paper approaches. Thus it is possible to:
- rotate or randomize the order in which questions are asked;
- rotate or randomize the order of response codes between respondents;
- sum numeric answers (eg to ensure that answers add to 100 per cent or to check total expenditure);
- insert responses to one question into the wording of another (eg ‘Of the £105 that you spent on wine, how much was spent on Australian wines?’ Here, both the total amount spent and one of the countries of origin of the wine bought were inserted from previous questions);
- adapt response lists according to answers to previous questions (eg the brands listed as possible responses may include only those previously given as being known to the respondent);
- ensure consistency between answers, and query apparent inconsistencies;
- require that a response be given before moving on to the next question;
- include more complex routeing between questions than would be possible with a paper questionnaire.
Questionnaire-writing programs often provide a range of standardized formats that can be customized to the research organization’s conventions and layouts. However, online questionnaires should not just be seen as paper questionnaires transferred to screen. They offer many opportunities for questionnaire writers to be more creative in the way in which they ask questions, to ask more complex questions that do not appear to be so, and to use prompt material that would not otherwise be possible.
1. Single or multiple pages
A key layout issue for web-based surveys is whether to:
- ask one question per page or screen;
- group questions into logical sets that follow on on the same page, requiring respondents to scroll down;
- have the complete questionnaire as a single scroll-down page.
This last format best replicates the paper questionnaire and has the advantage that respondents can see all of their answers to previous questions by scrolling up and down and be consistent in the way that they respond. This is the approach recommended by Dillman (2000).
However, this approach is generally only used for short, simple questionnaires. The reasons for this are that:
- If the complete questionnaire is contained in a single scroll-down page, the data is not sent to the administrator’s server until and if it has been completed.
- If it is abandoned part-way through then no data is collected from that respondent, and it may not even be known whether or not the respondent started the survey.
- This approach also rules out routeing between questions and so fails to take advantage of one of the medium’s key assets.
- Moreover, it has been shown (Van Schaik and Ling, 2007) that respondents complete the questionnaire more quickly when there is a single question per page. They are thought to be less distracted without the text and answers of other questions on screen at the same time.
It has become general practice for most research companies to use a single page per question, although a question may include more than one part. This makes it possible to include routeing between questions and helps to make the screen appear clear and uncluttered.
An exception is where there are a series of attributes to be assessed, usually using scales, when a group of attributes may be shown on the same page. There is some evidence (Couper, Traugott and Lamias, 2001) that this gives greater consistency between the items than if each one is shown on a separate page.
2. Screen design
The layout or screen design is a crucial issue with all self-completion questionnaires, and particularly so online. The question must be clearly seen by the respondent and all of the responses offered should not only be clear, but should if possible be seen at the same time, with no emphasis given to one response over another.
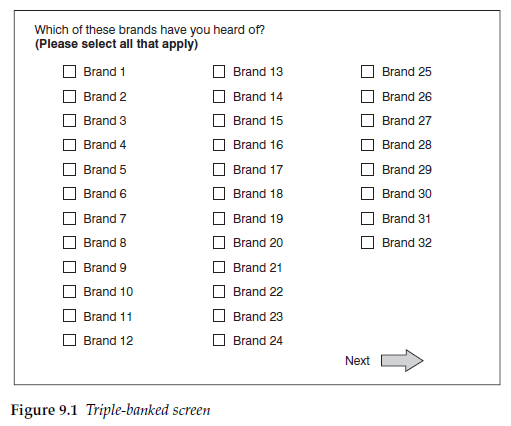
Where a single question per screen is used, a need for the respondent to scroll down should be avoided. All response codes should be included on the same screen if at all possible. This may mean double or triple banking them (Figure 9.1). If it is necessary to scroll down, many respondents will not realize the need to do so. Even if they have to scroll down in order to progress to the next question, they will tend to use the responses first apparent to them that they saw initially. An exception might be for a factual question where respondents have to scroll down to find their make of car or country of residence, where they are aware that they have to keep scrolling to find the answer they need.
The need for horizontal scrolling should always be avoided. Many respondents will either not see that they should scroll across or not bother to do so. This will lead to bias against the responses that are not apparent on the initial screen.
3. Minimizing effort and frustration
Minimizing the number of mouse clicks that a respondent has to make and the distance that the cursor has to travel are also generally regarded as important as they minimize the effort required from the respondent and maximize the probability of them continuing to the end.
If respondents fail to answer a question or complete it incorrectly, then they may be directed back to the page on which the error occurred and asked to answer the question again. This is a source of frustration that may lead to their breaking off. Clear instructions about how to complete answers can help respondents get it right first time and avoid the frustration of being returned to the page. Explicit instructions can be comple-mented by visual cues as to how the questionnaire writer wants something completed. In an experiment (Christian, Dillman and Smyth, 2007) it was shown that when asking for month and year of an event, providing a smaller box to enter the month and larger for the year rather than both the same size helped significantly more respondents to enter a four-digit year, as required, rather than a two-digit year, so reducing their frustration when asked to correct it.
4. Progress indicators
Respondents, not unreasonably, like to know how far through the questionnaire they are. One way of indicating their progress is the inclusion of question numbers. However, where there is routeing, and especially where there are question loops that are dependent on the respondents’ answers, these can be misleading. For these reasons, question numbering is rarely used with online questionnaires. An alternative indicator is a progress bar that lets respondents see how far through the questionnaire they are.
Experiments have shown that telling respondents how far through the questionnaire they are affects how difficult they expect the task to be and whether or not they continue or break off (Conrad et al, 2005). If respondents believe early on in the questionnaire that they are making good progress, they are more likely to persevere than if they think progress is slow. The inference from this is that progress bars may be positive with shorter questionnaires, but discourage continuation with long questionnaires, and their inclusion must be considered carefully.
An alternative is to provide occasional progress information, or to provide this information only later in the questionnaire once significant progress has been made.
If the questionnaire contains routeing such that time taken to complete it varies greatly between respondents, then a meaningful progress bar is difficult to achieve.
5. Open-ended questions
For open-ended questions respondents are usually asked to type the answer into a box provided. The response box should not be too small, as the size of the box supplied will affect the amount of response given. It has also been shown (Couper, Traugott and Lamias, 2001) that altering the size of the box for a numeric answer can also change the distribution of responses.
One of the uses for open-ended questions in online questionnaires that is not found in any other survey medium is for recording spontaneous awareness, particularly for brands. With interviewer-administered questionnaires this is usually recorded using a pre-coded list that is not seen by the respondent, while with postal questionnaires it is not a question that is possible to ask if any brand is mentioned anywhere in the questionnaire. In an online questionnaire, though, it can be asked as an open- ended question.
Frequently, when asking spontaneous awareness, the researcher wishes to know which was the first brand that came to mind, known as ‘top of mind awareness’. The online questionnaire writer has the choice of asking this as two questions:
- Which is the first brand of shaving cream that comes to mind?
- Which other brands of shaving cream can you think of?
The alternative is to ask one question:
- Which brands of shaving cream can you think of?
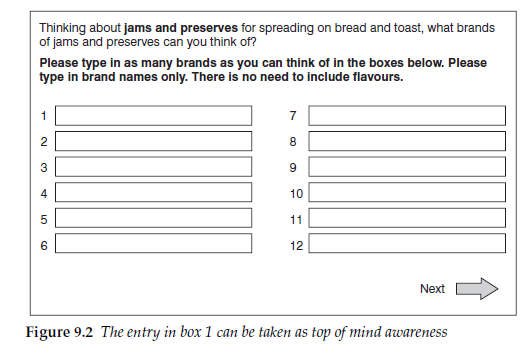
and to record responses in a series of boxes that can be labelled ‘First brand’, ‘Second brand’ and so on (Figure 9.2). This is generally preferable as the respondent has only one screen to read and complete rather than two. It also does not highlight the first brand, which may affect later responses. It has been shown that the two approaches give comparable results (Cape, Lorch and Piekarski, 2007) so there is no benefit in the longer approach.
6. Presenting scales in electronic questionnaires
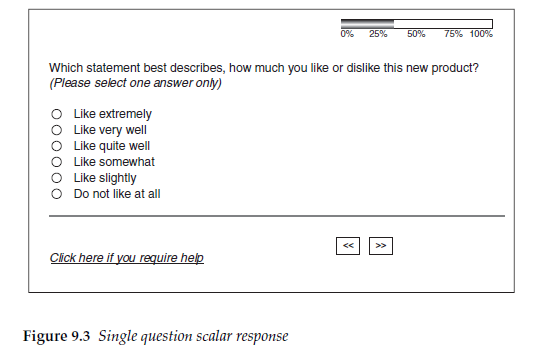
Electronic questionnaires, either online web-based or self-completion CAPI, provide alternative means of presenting scales and recording responses to those available on paper questionnaires. A simple version is the single question with a scalar response presented as radio buttons (Figure 9.3).
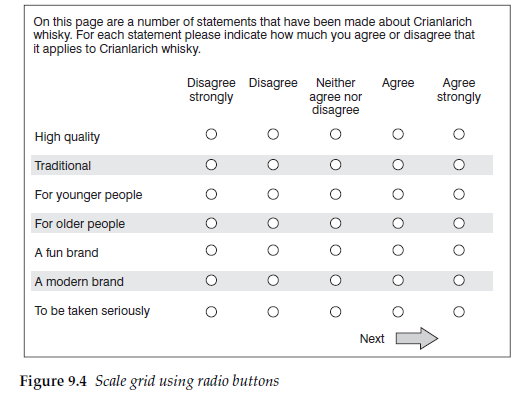
For more complex grids of statements and responses there are a number of options. One is to replicate the layout of paper questionnaires, with statements displayed down one side (or both sides if bi-polar) with the response options given as radio buttons across the page (Figure 9.4). This is a familiar layout to most questionnaire writers.
Online, the number of attitude dimensions or brand attributes shown per screen should be limited so that the task does not appear too daunting. This may mean spreading the attributes over more than one screen. Many research companies adopt conventions such as having no more than 10 or 12 statements to a screen to avoid scrolling down with this type of question. This then presents the researcher with issues of how to group the attributes and which to show on the same screen. It is usual to group them by topic, and possibly label them as such, but this needs to be considered alongside other requirements that may demand separating similar attributes.
For scalar questions, there are adaptations of paper questionnaire techniques available and some new techniques:
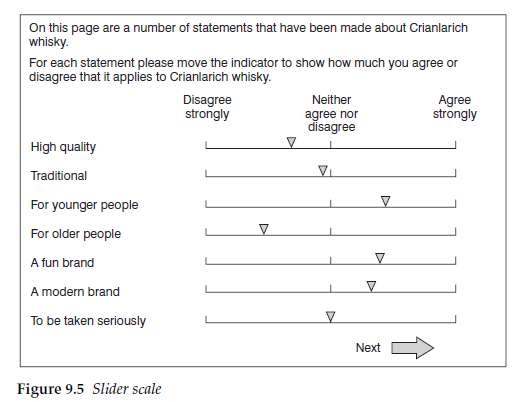
- slider scales;
- write-in boxes;
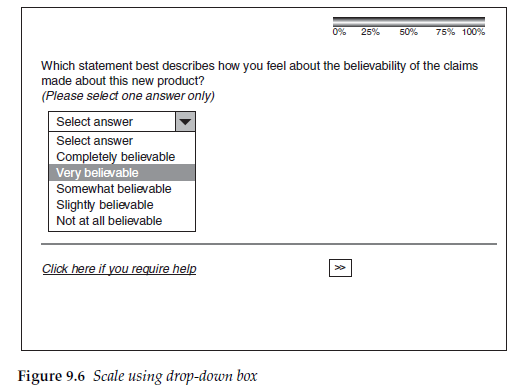
- drop-down boxes.
The use of different types of slider scales (see Figure 9.5), visual analog scales or graphic rating scales in electronic questionnaires has been discussed in Chapter 5, but we should note again here that it has been shown that whilst most respondents prefer a scale with defined points, such as radio buttons, because they believe that it is more difficult to give consistent answers with a slider scale, both slider scales and scales with defined responses give similar data distributions (Van Schaik and Ling, 2007).
With write-in boxes, respondents are asked to write in a number, say from one to five, to represent their response on a scale where the end points have been defined for them. This is a technique often avoided with paper questionnaires where the likelihood of error in misreading many different styles of handwriting is a deterrent. However, with electronic questionnaires, it is straightforward and accurately recorded. There is more effort involved for the respondents than with radio buttons, which only require them to move a mouse and click on the button. The space saved means that more items can be included on the same page, and brands can be rated more easily alongside each other.
An option only available with electronic questionnaires is the dropdown box (see Figure 9.6). A drop-down box following the statement can contain the full scale. Respondents only have to click on their choice of response for it to be displayed and recorded. Again, a little more effort is required than with radio buttons. There might also be concerns that the direction in which the scale is displayed, with either the positive or negative end of the scale at the top of the drop-down box, will introduce a bias. This bias could be expected to be greater than that associated with the direction of the scale when using radio buttons, as respondents may not read all the way down the scale.
However, work carried out by Hogg and Masztal (2001) has demonstrated that this is not the case. Their study, which compared radio buttons with write-in boxes and drop-downs, showed that both write-in and drop-down boxes gave greater dispersion of responses across a five- point scale than did radio buttons. With radio buttons there was a greater likelihood for respondents to use one point of the scale repeatedly (a type of pattern responding known as flat-lining). This suggests that both of the other two methods may result in respondents giving more consideration to each response. The more deliberate process of choosing a response option with these methods could mean that more consideration is given to what that response should be.
The results for the two versions of the drop-down, one with the positive end of the scale at the top of the box, the other with the negative end at the top, were almost identical, indicating that order is not a crucial issue, at least for five-point scales. However, it may become more so for longer scales, and as a precaution the order should be rotated between respondents to balance any potential bias.
It is important when using drop-down boxes that the default option, which shows prior to it being answered, is not one of the responses but a neutral statement such as ‘Select answer’.
There may be a concern that the additional time taken to complete the questionnaire could result in an increased rate of drop out. Hogg and Masztal found that although there was a small increase in the time taken, confirmed by Van Schaik and Ling (2007), there was no evidence of any increased drop out as a result.
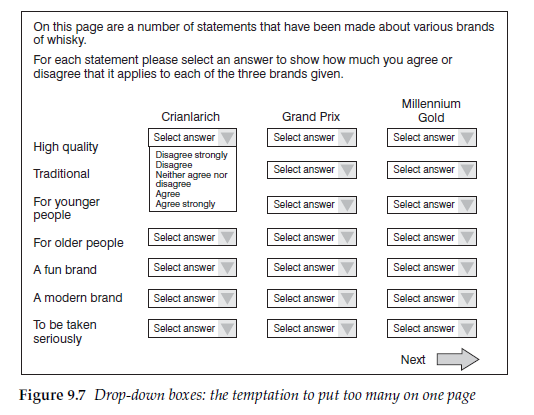
An advantage of both the drop-down and the write-in box is that more responses can be accommodated on one page. However, the questionnaire designer must take care not to make the page look overly complicated or daunting (Figure 9.7).
7. ‘Don’t know’ and ‘Not answered’ codes
With any self-completion questionnaire there is the issue of whether or not the inclusion of a ‘Don’t know’ code encourages ‘Don’t know’ responses, which the researcher usually wants to keep to a minimum. Such a response option is therefore often not provided.
Similarly, with online questionnaires the issue arises as to whether the respondent should be allowed to continue to the next question if no answer is recorded at all. To allow this would be to allow respondents to simply skip questions that they did not want to or felt unable to answer. For this reason, many web-based surveys do not permit the respondent to continue to the next question until an answer has been provided. The absence of a ‘Don’t know’ code and a requirement to enter a response before being able to proceed thus forces the respondent to give an answer. Several companies have carried out their own investigations that show that very few respondents terminate an interview because of the lack of a ‘Not answered’ (or ‘No opinion’) or ‘Don’t know’ code, nor does this significantly alter the distribution of responses. Against this it can be argued that there is an ethical issue that respondents should be allowed not to answer a question without having to terminate the interview or provide a random answer. There is also the question as to the value of an answer that a respondent has been forced to give unwillingly and that may simply be a random choice. In a parallel test, Cape, Lorch and Piekarski (2007) asked about brand ownership, using one sample with a ‘Don’t know’ code provided and one without. For the version with a ‘Don’t know’ code, 10 per cent selected that as their answer. In the version without that code, the ‘Other answers’ response was 9 percentage points higher. Without a ‘Don’t know’ code these respondents were selecting ‘Other answer’ as the closest they could get. But if ‘Other answer’ had not been provided, where would they have gone?
An alternative to having a ‘Don’t know’ response, which is adopted by some companies, is to have a screen or a pop-up that appears if a respondent tries to continue without having answered a question. This screen points out that they have not answered the previous question and gives the opportunity to return and complete it. The respondent must actively click to say that they do not want to or cannot answer the question before being allowed to continue to the next one. This approach, although it requires more complex programming, provides the researcher with full information about respondents’ abilities to answer questions and avoids them inventing answers just in order to proceed.
Questions that demand a response in order to route the respondent to the next question would normally treat a ‘Not answered’ as a ‘Don’t know’ and route accordingly.
If ‘Don’t know’ and ‘No opinion’ codes are to be included, the questionnaire writer must be aware that the positioning of them on the screen can affect the responses to other codes. If they are added to the end of a list of codes with no visual break between them, this can alter the way in which the respondent regards the list, by altering the perceived mid-point of the responses. This is particularly important if the response is in the form of a scale. In an experiment (Tourangeau, Couper and Conrad, 2004) it was shown that when ‘Don’t know’ and ‘No opinion’ codes were simply added to the end of a five-point scale presented vertically, a higher proportion of responses were given to the bottom two codes of the scale than when the ‘Don’t know’ and ‘No opinion’ responses were separated from the scale responses by a dotted line (Figure 9.8). Without the dotted line, the two codes at the bottom of the scale were visually closer to the middle of the response options. The questionnaire writer needs to make it visually clear that the ‘Don’t know’ and ‘No opinion’ options are not part of the scale.
Source: Brace Ian (2018), Questionnaire Design: How to Plan, Structure and Write Survey Material for Effective Market Research, Kogan Page; 4th edition.
20 Aug 2021
20 Aug 2021
20 Aug 2021
20 Aug 2021
20 Aug 2021
20 Aug 2021