We have shown how to calculate some common summary measures of Home Depot’s performance and financial condition. Now you need some way to judge whether they are high or low. In some cases, there may be a natural benchmark. For example, if a firm has negative economic value added or a return on capital less than the cost of that capital, it has not created wealth for its shareholders.
But what about some of our other measures? There is no right level for, say, the asset turnover or profit margin, and if there were, it would almost certainly vary from year to year and industry to industry. Therefore, when assessing company performance, managers usually look first at how the financial ratios have changed over time, and then they look at how their measures stack up in comparison with companies in the same line of business.
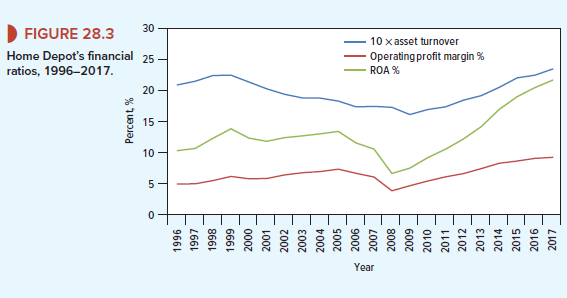
We will first compare Home Depot’s position in 2017 with its performance in earlier years. For example, Figure 28.3 plots Home Depot’s return on assets since 1996. We know that ROA = asset turnover x operating profit margin. Figure 28.3 shows that beginning in 1999, there was a steady decline in the company’s ability to generate sales from its assets, though for a while this effect was largely offset by a rise in the profit margin. When the downturn in the housing market in 2008 also led to a sharp decline in the profit margin, Home Depot’s ROA fell dramatically. The turnaround came under new management in 2009, and in each of the following years, the company was able to increase both the rate of asset turnover and the profit margin.
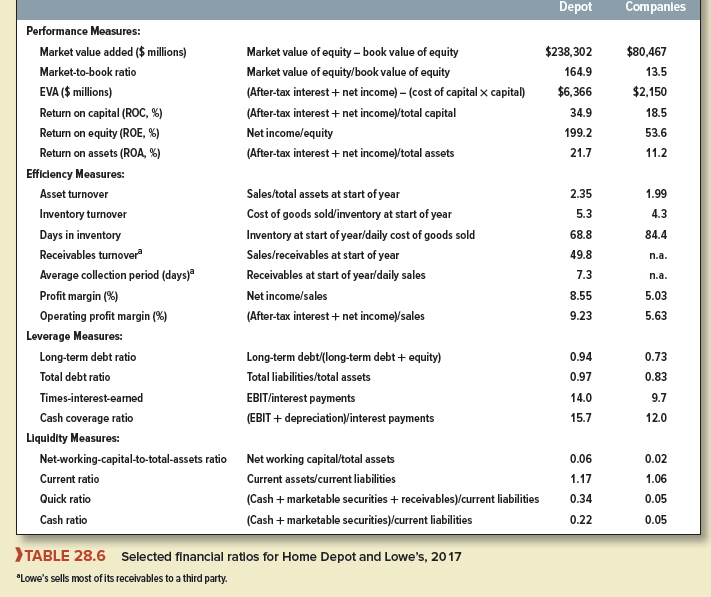
Managers also need to ask themselves how the company’s performance compares with that of its principal competitors. Table 28.6 sets out some key performance measures for Home Depot and Lowe’s.18 Home Depot has the higher asset turnover ratio and operating profit margin and these combine to produce a higher return on assets. Home Depot has higher book debt ratios, but, thanks to its greater profitability, it has the higher interest cover. Its assets also appear to be more liquid.
Home Depot and Lowe’s are fairly close competitors, and it makes sense to compare their financial ratios. However, all financial ratios must be interpreted in the context of industry norms. For example, you would not expect a soft-drink manufacturer to have the same profit margin as a jeweler or the same leverage as a finance company. You can see this from Table 28.7, which presents some financial ratios for a sample of industry groups.
Notice the large variation across industries. Some of these differences, particularly in profitability measures, may arise from chance; for example, in 2017 the sun shone less kindly on the oil industry. But other differences may reflect more fundamental factors. For example, telecoms and utility companies tend to have high debt ratios, which persist in good years and bad. In comparison, business equipment companies tend to borrow far less. We pointed out earlier that some businesses are able to generate a high level of sales from relatively few assets. You can see that this is the case for retail companies. On the other hand, these companies earn a relatively low profit margin on these sales. By contrast, utilities turn over their assets more slowly but earn a much higher margin of profit on their sales.
Now I am ready to do my breakfast, when having my breakfast coming again to read additional news.
Hello. excellent job. I did not expect this. This is a fantastic story. Thanks!