Attractive ideas must be refined into testable product concepts. A product idea is a possible product the company might offer to the market. A product concept is an elaborated version of the idea expressed in consumer terms.
1. CONCEPT DEVELOPMENT AND TESTING
Concept development is a necessary but not sufficient step for new-product success. Marketers must also distinguish winning concepts from losers by testing.
CONCEPT DEVELOPMENT Imagine a large food-processing company gets the idea of producing a powder to add to milk to increase its nutritional value and taste. This is a product idea, but consumers don’t buy product ideas; they buy product concepts.
A product idea can be turned into several concepts. The first question is: Who will use this product? It can be aimed at infants, children, teenagers, young or middle-aged adults, or older adults. Second, what primary benefit should this product provide—taste, nutrition, refreshment, or energy? Third, when will people consume this drink—at breakfast, midmorning, for lunch, midafternoon, with dinner, late evening? By answering these questions, a company can form several concepts:
- Concept 1. An instant drink for adults who want a quick nutritious breakfast without preparation.
- Concept 2. A tasty snack for children to drink as a midday refreshment.
- Concept 3. A health supplement for older adults to drink in the late evening before bed.
Each concept represents a category concept that defines the product’s competition. An instant breakfast drink would compete against bacon and eggs, breakfast cereals, coffee and pastry, and other breakfast alternatives. A snack drink would compete against soft drinks, fruit juices, sports drinks, and other thirst quenchers.
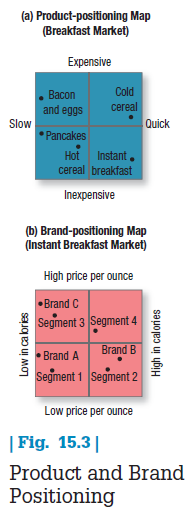
Suppose the instant-breakfast-drink concept looks best. The next task is to show where this powdered product would stand in relationship to other breakfast products via perceptual mapping. Figure 15.3(a) uses the two dimensions of cost and preparation time to create a product-positioning map for the breakfast drink, which offers low cost and quick preparation. Its nearest competitors are cold cereal and breakfast bars; its most distant is bacon and eggs. These contrasts can help communicate and promote the concept to the market.
Next, the product concept becomes a brand concept. Figure 15.3(b) is a brand-positioning map, a perceptual map showing the current positions of three existing brands of instant breakfast drinks (A-C) as seen by consumers. As Chapter 10 described, it can also be useful to overlay current or desired consumer preferences on to the map. Figure 15.3(b) also shows four segments of consumers (1-4) whose preferences are clustered around the points on the map.
The brand-positioning map helps the company decide how much to charge and how calorific to make its drink. Three segments (1-3) are well served by existing brands (A-C). The company would not want to position itself next to one of those existing brands, unless that brand is weak or inferior or market demand was high enough to be shared. As it turns out, the new brand would be distinctive in the medium-price, medium-calorie market or in the high-price, high-calorie market. There is also a segment of consumers (4) clustered fairly near the medium-price, medium-calorie market, suggesting this may offer the greatest opportunity.
CONCEPT TESTING Concept testing means presenting the product concept to target consumers, physically or symbolically, and getting their reactions. The more the tested concepts resemble the final product or experience, the more dependable concept testing is. Concept testing of prototypes can help avoid costly mistakes, but it may be especially challenging with radically different, new-to-the-world products.79 Visualization techniques can help respondents match their mental state with what might occur when they are actually evaluating or choosing the new product.80
In the past, creating physical prototypes was costly and time consuming, but today firms can use rapid prototyping to design products on a computer and then produce rough models to show potential consumers for their reactions. Firms developing big-ticket items such as orthopedic devices for knee replacements or electric cars use rapid prototyping in new-product development to save time and money.81 In response to a short-term oversupply of wine in the marketplace, the makers of Kendall-Jackson developed two new brands by using rapid prototyping to quickly bring their ideas to life, selling 100,000 cases of each brand, 10 times more than expected, in the process.82
Companies are also using virtual reality to test product concepts. Virtual reality programs use computers and sensory devices (such as gloves or goggles) to simulate reality. Lockheed Martin uses virtual reality to develop its GPS satellites for the U.S. Air Force.83 Supercomputers allow for elaborate product testing to assess changes in performance and supplement consumer input. Kenworth used to test new truck designs with clay models and wind tunnels. Using supercomputer analysis, it can now make more accurate estimates of how much drag and fuel use it can eliminate with new trimmed and tapered mud flaps (answer: $400 of a typical truck’s annual gas bill).84
Concept testing presents consumers with an elaborated version of the concept. Here is the elaboration of concept 1 in our milk example:
Our product is a powdered mixture added to milk to make an instant breakfast that gives all the day’s needed nutrition along with good taste and high convenience. The product comes in three flavors (chocolate, vanilla, and strawberry) and individual packets, six to a box, at $2.49 a box.
After receiving this information, researchers measure product dimensions by having consumers respond to questions like these:
- Communicability and believability—“Are the benefits clear to you and believable?” If the scores are low, the concept must be refined or revised.
- Need level—“Do you see this product solving a problem or filling a need for you?” The stronger the need, the higher the expected consumer interest.
- Gap level—“Do other products currently meet this need and satisfy you?” The greater the gap, the higher the expected consumer interest. Marketers can multiply the need level by the gap level to produce a need-gap score. A high score means the consumer sees the product as filling a strong need not satisfied by available alternatives.
- Perceived value—“Is the price reasonable in relationship to value?” The higher the perceived value, the higher is expected consumer interest.
- Purchase intention—“Would you (definitely, probably, probably not, definitely not) buy the product?” Consumers who answered the first three questions positively should answer “Definitely” here.
- User targets, purchase occasions, purchasing frequency—“Who would use this product, when, and how often?”
Respondents’ answers indicate whether the concept has a broad and strong consumer appeal, what products it competes against, and which consumers are the best targets. The need-gap levels and purchase-intention levels can be checked against norms for the product category to see whether the concept appears to be a winner, a long shot, or a loser. One food manufacturer rejects any concept that draws a definitely-would-buy score lower than 40 percent.
CONJOINT ANALYSIS Consumer preferences for alternative product concepts can be measured with conjoint analysis, a method for deriving the utility values that consumers attach to varying levels of a product’s attributes.85 Conjoint analysis has become one of the most popular concept-development and testing tools. For example, Marriott used it to design its Courtyard hotel concept.86
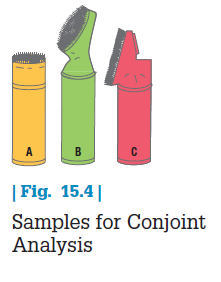
With conjoint analysis, respondents see different hypothetical offers formed by combining varying levels of the attributes and rank them. Management can then identify the most appealing offer and its estimated market share and profit. In a classic illustration, academic research pioneers Green and Wind used this approach in connection with developing a new spot-removing, carpet-cleaning agent for home use.87 Suppose the new-product marketer is considering five design elements:
- Three package designs (A, B, C—see Figure 15.4)
- Three brand names (K2R, Glory, Bissell)
- Three prices ($1.19, $1.39, $1.59)
- A possible Good Housekeeping seal (yes, no)
- A possible money-back guarantee (yes, no)
Although the researcher can form 108 possible product concepts with these five elements (3 x 3 x 3 x 2 x 2), it would be too much to ask consumers to rank them all from most to least preferred. A sample of, say, 18 contrasting product concepts is feasible.
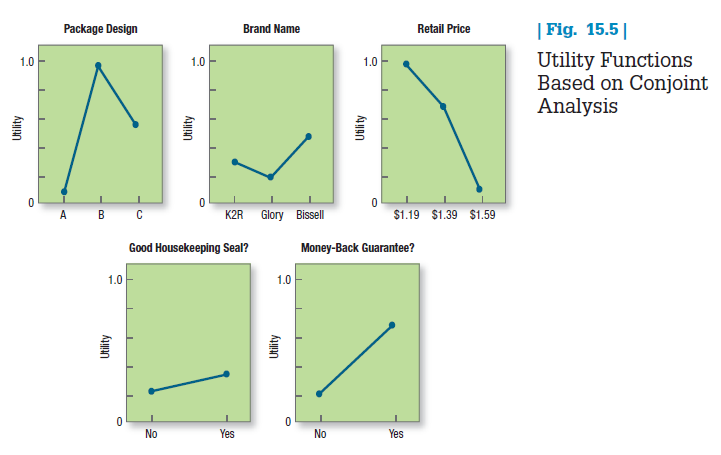
The marketer now uses a statistical program to derive the consumer’s utility functions for each of the five at- tributes (see Figure 15.5). Utility ranges between zero and one; the higher the utility, the stronger the consumer’s preference for that level of the attribute. Looking at packaging, package B is the most favored, followed by C and then A (A has hardly any utility). The preferred names are Bissell, K2R, and Glory in that order. The consumer’s utility varies inversely with price. A Good Housekeeping seal is preferred, but it does not add that much utility and may not be worth the effort to obtain it. A money-back guarantee is strongly preferred.
The consumer’s most desired offer is package design B, brand name Bissell, priced at $1.19, with a Good Housekeeping seal and a money-back guarantee. We can also determine the relative importance to this consumer of each attribute—the difference between the highest and lowest utility level for that attribute. The greater the difference, the more important the attribute. Clearly, this consumer sees price and package design as the most important attributes, followed by money-back guarantee, brand name, and a Good Housekeeping seal.
Preference data from a sufficient sample of target consumers help to estimate the market share any specific offer is likely to achieve, given any assumptions about competitive response. Still, the company may not launch the market offer that promises to gain the greatest market share because of cost considerations. The most customer- appealing offer is not always the most profitable offer to make.
Under some conditions, researchers will collect the data by presenting not a full-profile description of each offer, but two factors at a time. For example, respondents may see a table with three price levels and three package types and indicate which of the nine combinations they would like best, second-best, and so on. Another table consists of trade-offs between two other variables. This trade-off approach may be easier to use when there are many variables and possible offers. However, it is less realistic in that respondents are focusing on only two variables at a time. Adaptive conjoint analysis (ACA) is a “hybrid” data collection technique that combines self-stated or explicated importance ratings of attributes with pair-wise trade-off tasks comparing two options.88
2. MARKETING STRATEGY DEVELOPMENT
Following a successful concept test, the new-product manager will develop a preliminary three-part strategy plan for introducing the new product into the market. The first part describes the target market’s size, structure, and behavior; the planned brand positioning; and the sales, market share, and profit goals sought in the first few years:
The target market for the instant breakfast drink is families with children who are receptive to a new, convenient, nutritious, and inexpensive form of breakfast. The company’s brand will be positioned at the higher-price, higher-quality end of the instant-breakfast-drink category. The company will aim initially to sell 500,000 cases or 10 percent of the market, with a loss in the first year not exceeding $1.3 million. The second year it will aim for 700,000 cases or 14 percent of the market, with a planned profit of $2.2 million.
The second part outlines the planned price, distribution strategy, and marketing budget for the first year:
The product will be offered in chocolate, vanilla, and strawberry, in individual packets of six to a box, at a retail price of $2.49 a box. There will be 48 boxes per case, and the case price to distributors will be $24. For the first two months, dealers will be offered one case free for every four cases bought, plus cooperative-advertising allowances. Free samples will be distributed in stores. Coupons for 50 cents off will appear in newspapers and online. The total sales promotional budget will be $2.9 million. An advertising budget of $6 million will be split 50:50 between national and local. Two-thirds will go into television and one-third into online. Advertising copy will emphasize the benefit concepts of nutrition and convenience. The advertising-execution concept will revolve around a small boy who drinks instant breakfast and grows strong. During the first year, $100,000 will be spent on marketing research to buy store audits and consumer-panel information to monitor market reaction and buying rates.
The third part of the marketing strategy plan describes the long-run sales and profit goals and marketing-mix strategy over time:
The company intends to win a 25 percent market share and realize an after-tax return on investment of 12 percent. To achieve this return, product quality will start high and be improved over time through technical research. Price will initially be set at a high level and gradually drop to expand the market and meet competition. The total promotion budget will be boosted about 20 percent each year, with the initial advertising-sales promotion split of 65:35 eventually evolving to 50:50. Marketing research will be reduced to $60,000 per year after the first year.
3. BUSINESS ANALYSIS
After management develops the product concept and marketing strategy, it can evaluate the proposal’s business attractiveness. Management needs to prepare sales, cost, and profit projections to determine whether they satisfy company objectives. If they do, the concept can move to the development stage. As new information comes in, the business analysis will undergo revision and expansion.
ESTIMATING TOTAL SALES Total estimated sales are the sum of estimated first-time sales, replacement sales, and repeat sales. Sales-estimation methods depend on whether the product is purchased once (such
as an engagement ring or retirement home), infrequently, or often. For one-time products, sales rise at the beginning, peak, and approach zero as the number of potential buyers becomes exhausted [see Figure 15.6(a)]. If new buyers keep entering the market, the curve will not go to zero.
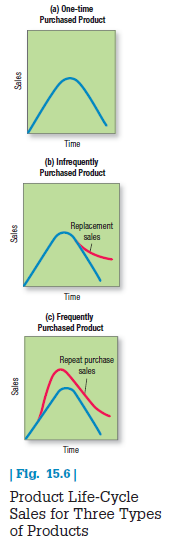
Infrequently purchased products—such as automobiles, microwaves, and industrial equipment— exhibit replacement cycles dictated by physical wear or obsolescence associated with changing styles, features, and performance. Sales forecasting for this product category calls for estimating first-time sales and replacement sales separately [see Figure 15.6(b)].
Frequently purchased products, such as consumer and industrial nondurables, have product life-cycle sales resembling Figure 15.6(c). The number of first-time buyers initially increases and then decreases as fewer buyers are left (assuming a fixed population). Repeat purchases occur soon, providing the product satisfies some buyers. The sales curve eventually falls to a plateau representing a level of steady repeat-purchase volume; by this time, the product is no longer a new product.
In estimating sales, the manager’s first task is to estimate first-time purchases of the new product in each period. To estimate replacement sales, management researches the product’s survival-age distribution—that is, the number of units that fail in year one, two, three, and so on. The low end of the distribution indicates when the first replacement sales will take place. Because replacement sales are difficult to estimate before the product is in use, some manufacturers base the decision to launch a new product on their estimate of first-time sales alone.
For a frequently purchased new product, the seller estimates repeat sales as well as first-time sales. A high rate of repeat purchasing means customers are satisfied; sales are likely to stay high even after all first-time purchases take place. Some products and brands are bought a few times and dropped. Colgate’s Wisp disposable toothbrush received much trial, but repeat sales slowed considerably after that.89
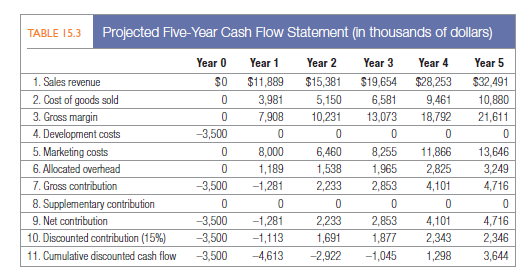
ESTIMATING COSTS AND PROFITS Costs are estimated by the R&D, manufacturing, marketing, and finance departments. Table 15.3 illustrates a five-year projection of sales, costs, and profits for the instant breakfast drink.
Row 1 shows projected sales revenue over the five-year period. The company expects to sell $11,889,000 (approximately 500,000 cases at $24 per case) in the first year. Behind this projection is a set of assumptions about the rate of market growth, the company’s market share, and the factory-realized price. Row 2 shows the cost of goods sold, which hovers around 33 percent of sales revenue. We find this cost by estimating the average cost of labor, ingredients, and packaging per case. Row 3 shows the expected gross margin, the difference between sales revenue and cost of goods sold.
Row 4 shows anticipated development costs of $3.5 million, including product-development cost, marketing research costs, and manufacturing development costs. Row 5 shows the estimated marketing costs over the five-year period to cover advertising, sales promotion, and marketing research and an amount allocated for sales force coverage and marketing administration. Row 6 shows the allocated overhead to this new product to cover its share of the cost of executive salaries, heat, light, and so on.
Row 7, the gross contribution, is gross margin minus the preceding three costs. Row 8, supplementary contribution, lists any change in income to other company products caused by the new-product introduction. Dragalong income is additional income to them, and cannibalized income is reduced income.90 Table 15.3 assumes no supplementary contributions. Row 9 shows net contribution, which in this case is the same as gross contribution. Row 10 shows discounted contribution—that is, the present value of each future contribution discounted at 15 percent per annum. For example, the company will not receive $4,716,000 until the fifth year. This amount is worth only $2,346,000 today if the company can earn 15 percent on its money through other investments.91
Finally, row 11 shows the cumulative discounted cash flow, the accumulation of the annual contributions in row 10. Two points are of central interest. First is the maximum investment exposure, the highest loss the project can create. The company will be in a maximum loss position of $4,613,000 in year 1. The second is the payback period, the time when the company recovers all its investment, including the built-in return of 15 percent. The payback period here is about three and a half years. Management must decide whether to risk a maximum investment loss of $4.6 million and a possible payback period of three and a half years. As part of their financial analysis, firms may conduct a breakeven or risk analysis.
Source: Kotler Philip T., Keller Kevin Lane (2015), Marketing Management, Pearson; 15th Edition.
I enjoy, result in I found just what I used to be having a look for. You have ended my four day long hunt! God Bless you man. Have a nice day. Bye