If you are extending credit to a customer or making a short-term bank loan, you are interested in more than the company’s leverage. You want to know whether the company can lay its hands on the cash to repay you. That is why credit analysts and bankers look at several measures of liquidity. Liquid assets can be converted into cash quickly and cheaply.
Think, for example, what you would do to meet a large unexpected bill. You might have some money in the bank or some investments that are easily sold, but you would not find it so easy to turn your old sweaters into cash. Companies, likewise, own assets with different degrees of liquidity. For example, accounts receivable and inventories of finished goods are generally quite liquid. As inventories are sold off and customers pay their bills, money flows into the firm. At the other extreme, real estate may be very illiquid. It can be hard to find a buyer, negotiate a fair price, and close a deal on short notice.
Managers have another reason to focus on liquid assets: Their book (balance sheet) values are usually reliable. The book value of a catalytic cracker may be a poor guide to its true value, but at least you know what cash in the bank is worth. Liquidity ratios also have some less desirable characteristics. Because short-term assets and liabilities are easily changed, measures of liquidity can rapidly become outdated. You might not know what the catalytic cracker is worth, but you can be fairly sure that it won’t disappear overnight. Cash in the bank can disappear in seconds.
Also, assets that seem liquid sometimes have a nasty habit of becoming illiquid. This happened during the subprime mortgage crisis in 2007. Some financial institutions had set up funds known as structured investment vehicles (SIVs) that issued short-term debt backed by residential mortgages. As mortgage default rates began to climb, the market in this debt dried up and dealers became very reluctant to quote a price. Investors who were forced to sell found that the prices that they received were less than half the debt’s estimated value.
Bankers and other short-term lenders applaud firms that have plenty of liquid assets. They know that when they are due to be repaid, the firm will be able to get its hands on the cash. But more liquidity is not always a good thing. For example, efficient firms do not leave excess cash in their bank accounts. They don’t allow customers to postpone paying their bills, and they don’t leave stocks of raw materials and finished goods littering the warehouse floor. In other words, high levels of liquidity may indicate sloppy use of capital. Here, EVA can help because it penalizes managers who keep more liquid assets than they really need.
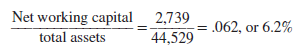
Net-Working-Capital-to-Total-Assets Ratio Current assets include cash, marketable securities, inventories, and accounts receivable. Current assets are mostly liquid. The difference between current assets and current liabilities is known as net working capital. Since current assets usually exceed current liabilities, net working capital is generally positive. For Home Depot,
Net working capital = 18,933 – 16,194 = $2,739 million
Net working capital was 6.2% of total assets:
Current Ratio The current ratio is just the ratio of current assets to current liabilities:
![]()
Home Depot has $1.17 in current assets for every dollar in current liabilities.
Changes in the current ratio can be misleading. For example, suppose that a company borrows a large sum from the bank and invests it in marketable securities. Current liabilities rise and so do current assets. If nothing else changes, net working capital is unaffected but the current ratio changes. For this reason, it is sometimes preferable to net short-term investments against short-term debt when calculating the current ratio.
Quick (Acid-Test) Ratio Some current assets are closer to cash than others. If trouble comes, inventory may not sell at anything above fire-sale prices. (Trouble typically comes because the firm can’t sell its inventory of finished products for more than production cost.) Thus, managers often exclude inventories and other less liquid components of current assets when comparing current assets to current liabilities. They focus instead on cash, marketable securities, and bills that customers have not yet paid. This results in the quick ratio:
![]()
Cash Ratio A company’s most liquid assets are its holdings of cash and marketable securities. That is why analysts also look at the cash ratio:
![]()
A low cash ratio may not matter if the firm can borrow on short notice. Who cares whether the firm has actually borrowed from the bank or whether it has a guaranteed line of credit so it can borrow whenever it chooses? None of the standard measures of liquidity takes the firm’s “reserve borrowing power” into account.
Good day! This is my first visit to your blog! We are a collection of volunteers and starting a new project in a community in the same niche. Your blog provided us beneficial information to work on. You have done a wonderful job!