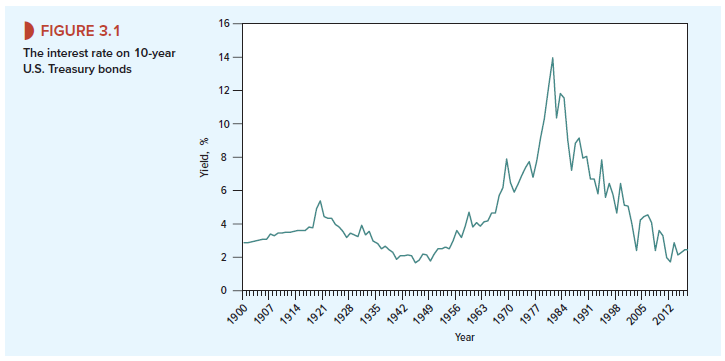
Figure 3.1 plots the yield to maturity on 10-year U.S. Treasury bonds[1] from 1900 to 2017. Notice how much the rate fluctuates. For example, interest rates climbed sharply after 1979 when Paul Volcker, the new chairman of the Fed, instituted a policy of tight money to rein in inflation. Within two years the interest rate on 10-year government bonds rose from 9% to a midyear peak of 15.8%. Contrast this with the summer of 2016, when long-term Treasury bonds offered a measly 1.4% rate of interest.
As interest rates change, so do bond prices. For example, suppose that investors demanded a semiannual return of 2% on the 8s of 2021, rather than the .947% semiannual return we used previously. In that case the price would be
![]()
The higher interest rate results in a lower price.
Bond prices and interest rates must move in opposite directions. The yield to maturity, our measure of the interest rate on a bond, is defined as the discount rate that explains the bond price. When bond prices fall, interest rates (i.e., yields to maturity) must rise. When interest rates rise, bond prices must fall. We recall a hapless TV pundit who intoned, “The recent decline in long-term interest rates suggests that long-term bond prices may rise over the next week or two.” Of course, the bond prices had already gone up. We are confident that you won’t make the pundit’s mistake.
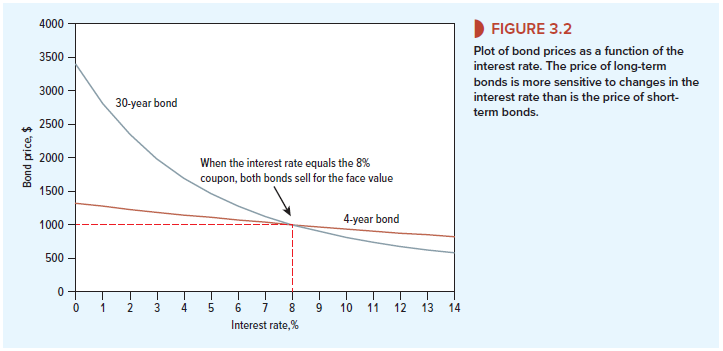
The brown line in Figure 3.2 shows the value of our 8% bond for different interest rates. As the yield to maturity falls, the bond price increases. When the annual yield is equal to the bond’s annual coupon rate (8%), the bond sells for exactly its face value. When the yield is higher than 8%, the bond sells at a discount to face value. When the yield is lower than 8%, the bond sells at a premium.
Bond investors cross their fingers that market interest rates will fall so that the price of their securities will rise. If they are unlucky and interest rates jump up, the value of their investment declines.
Example 3.1 • Changes in Interest Rates and Bond Returns
On May 15, 2008, the U.S. Treasury sold $9 billion of 4.375% bonds maturing in February 2038. The bonds were issued at a price of 96.38% and offered a yield to maturity of 4.60%. This was the return to anyone buying at the issue price and holding the bonds to maturity.
In the months following the issue, the financial crisis reached its peak. Lehman Brothers filed for bankruptcy with assets of $691 billion, and the government poured money into rescuing Fannie Mae, Freddie Mac, AIG, and a host of banks. As investors rushed to the safety of Treasury bonds, prices soared. By mid-December, the price of the 4.375s of 2038 had reached 138.05% of face value, and the yield had fallen to 2.5%. Anyone fortunate enough to have bought the bond at the issue price would have made a capital gain of $1,380.50 – $963.80 = $416.70. In addition, on August 15 the bond made its first coupon payment of $21.875 (this is the semiannual payment on the 4.375% coupon bond with a face value of $1,000). Our lucky investor would, therefore, have earned a seven-month rate of return of 45.5%:
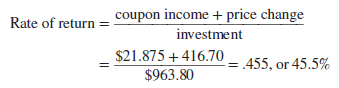
Suddenly, government bonds did not seem quite so boring as before.
A change in interest rates has only a modest impact on the value of near-term cash flows but a much greater impact on the value of distant cash flows. Thus the price of long-term bonds is affected more by changing interest rates than the price of short-term bonds. For example, compare the two curves in Figure 3.2. The brown line shows how the price of the four-year 8% bond varies with the interest rate. The blue line shows how the price of a 30-year 8% bond varies. You can see that the 30-year bond is much more sensitive to interest rate fluctuations than the four-year bond.
1. Duration and Volatility
Changes in interest rates have a greater impact on the prices of long-term bonds than on those of short-term bonds. But what do we mean by “long term” and “short term”? A coupon bond that matures in year 30 makes payments in each of years 1 through 30. It’s misleading to describe the bond as a 30-year bond; the average time to each cash payment is less than 30 years.
Example 3.2 • Which Is the Longer-Term Bond?
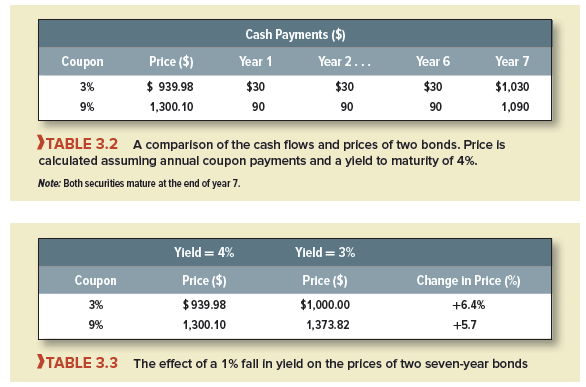
Table 3.2 calculates the prices of two seven-year bonds. We assume annual coupon payments and a yield to maturity of 4% per year. Take a look at the time pattern of each bond’s cash payments and review how the prices are calculated:
Which of these two bonds is the longer-term investment? They both have the same final maturity, of course. But the timing of the bonds’ cash payments is not the same. In the case of the 3s, the average time to each cash flow is longer, because a higher proportion of the cash flows occurs at maturity, when the face value is paid off.
Suppose now that the yield to maturity on each bond falls to 3%. Which bond would you most like to own? The 3s, of course. Since they have the longer effective life, they should benefit most from a fall in yields. Table 3.3 confirms that this is indeed the case:.
The 9s have the shorter average life and therefore a shift in interest rates has a more muted effect on the price. That much is clear. However, it would be useful to have a precise measure of the average life, one that could be used to predict the exposure of each bond’s price to fluctuations in interest rates. There is such a measure, and it is called duration or Macaulay duration after its founder.
Duration is the weighted average of the times to each of the cash payments. The times are the future years 1, 2, 3, etc., extending to the final maturity date, which we call T. The weight for each year is the present value of the cash flow received at that time divided by the total present value of the bond.
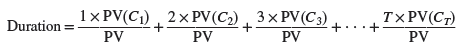
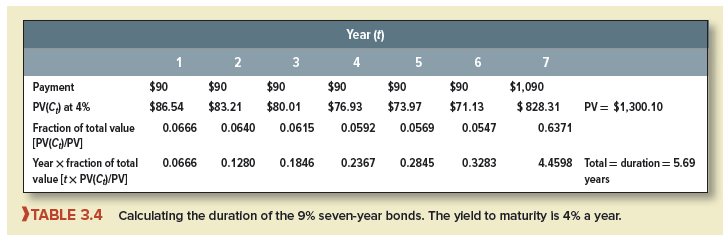
Table 3.4 shows how to compute duration for the 9% seven-year bonds, assuming annual payments. First, we value each of the coupon payments of $90 and the final payment of coupon plus face value of $1,090. Of course, the present values of these payments add up to the bond price of $1,300.10. Then we calculate the fraction of the price accounted for by each cash flow and multiply each fraction by the year of the cash flow. The results sum across to a duration of 5.69 years.
We leave it to you to calculate durations for the 3% bonds in Table 3.2. You will find that duration increases to 6.40 years.
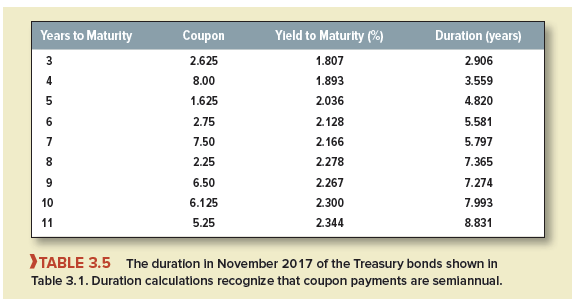
Table 3.5 shows the duration in November 2017 of the sample of U.S. Treasury bonds set out in Table 3.1. Notice that, in all cases, the duration is shorter than the number of years to maturity and that the difference is most marked in the case of high coupon bonds.
We mentioned that investors and financial managers track duration because it measures how bond prices change when interest rates change. For this purpose, it’s best to use modified duration or volatility, which is just duration divided by one plus the yield to maturity:
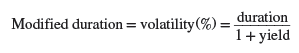
Modified duration measures the percentage change in bond price for a 1 percentage-point change in yield.[2] Let’s try out this formula for our seven-year 9% bond in Table 3.3. The bond’s modified duration is duration/(1 + yield) = 5.69/1.04 = 5.47. This means that a 1% change in the yield to maturity should change the bond price by 5.47%.
Let’s check that prediction. Suppose the yield to maturity either increases or declines by .5%:
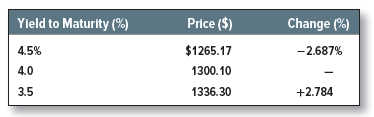
The total percentage difference between price at yields of 4.5% and 3.5% is 2.687 + 2.784 = 5.47%. Thus, a 1% change in interest rates means a 5.47% change in bond price, just as predicted.7
The modified duration for the 3% bond in Table 3.3 is 6.40/1.04 = 6.15%. In other words, a 1% change in yield to maturity results in a 6.15% change in the bond’s price. You can see why duration (or modified duration) is a handy measure of interest-rate risk.8
For example, the mini-case at the end of Chapter 26 looks at how financial managers can use the measure to protect the pension plan against unexpected changes in interest rates.
23 Jun 2021
25 Jun 2021
24 Jun 2021
24 Jun 2021
23 Jun 2021
25 Jun 2021