After markets have been segmented so that the firm can target particular customer groups, the next step is to find out what customers want and expect. This takes analysis and research. A severe mistake is to assume the firm knows what customers want and expect. Countless research studies reveal large differences between how customers define service and rank the importance of different service activities versus how companies view services. Many firms have become successful by filling the gap between what customers versus companies see as good service. What the customer believes is good service is paramount, not what the producer believes service should be.
Product positioning (sometimes called perceptual mapping) entails developing schematic representations that reflect how products or services compare to those of the competitors on dimensions most important to success in the industry. Product positioning is widely used for deciding how to meet the needs and wants of particular consumer groups. The technique can be summarized in five steps:
- Select key criteria that effectively differentiate products or services in the industry.
- Diagram a two-dimensional product-positioning map with specified criteria on each axis.
- Plot major competitors’ products or services in the resultant four-quadrant matrix.
- Identify areas in the positioning map where the company’s products or services could be most competitive in the given target market. Look for vacant areas (niches).
- Develop a marketing plan to position the company’s products or services appropriately.
Because just two criteria can be examined on a single product-positioning (perceptual) map, multiple maps are often developed to assess various approaches to strategy implementation. Multidimensional scaling could be used to examine three or more criteria simultaneously, but this technique is beyond the scope of this text. Some rules for using product positioning as a strategy-implementation tool are the following:
- Look for the hole or vacant niche, which is a segment of the market currently not being served.
- Do not serve two segments with the same strategy. Usually, a strategy successful with one segment cannot be directly transferred to another segment.
- Do not position yourself in the middle of the map. The middle usually indicates a strategy that is not clearly perceived to have any distinguishing characteristics. This rule can vary with the number of competitors. For example, when there are only two competitors, as in S. presidential elections, the middle becomes the preferred strategic position.6
An effective product-positioning strategy meets two criteria: (1) it uniquely distinguishes a company from the competition and (2) it leads customers to expect slightly less service than a company can deliver. Network Equipment Technology is an example of a company that keeps customer expectations slightly below perceived performance. This is a constant challenge for marketers. Firms need to inform customers about what to expect and then exceed the promise. Underpromise and overdeliver! That is a key for excellent strategy implementation.
The product positioning map, or perceptual map, in Figure 8-2 shows consumer perceptions of various automobiles on the two dimensions of sporty and conservative and classy and affordable. This sample of consumers felt Porsche was the sportiest and classiest of the cars in the study (top right corner) and Plymouth was the most practical and conservative (bottom left corner). Car manufacturers focus their marketing efforts on various target groups, or design features in their vehicles, based on research and survey information illustrated in perceptual maps. Perceptual maps can aid marketers in being more effective in spending money to promote products. Products, brands, or companies positioned close to one another are perceived as similar on the relevant dimensions. For example, in Figure 8-2, consumers see Lincoln, Mercedes, and Cadillac as similar. They are close competitors and form a competitive grouping. A company considering the introduction of a new or improved model may look for a vacant niche on a perceptual map. Some perceptual maps use different size circles to indicate the sales volume or market share of the various competing products.
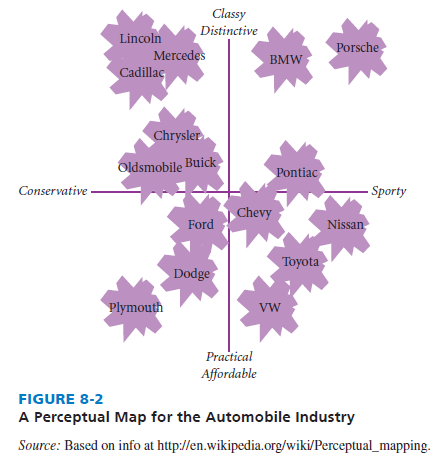
Perceptual maps may also display consumers’ ideal points. These points reflect ideal combinations of the two dimensions as seen by a consumer. Dots are often used to represent one respondent’s ideal combination of the two dimensions. Areas where there is a cluster of ideal points indicates a market segment. Areas without ideal points are sometimes referred to as demand voids. A company considering introducing a new product will look for areas with a high density of ideal points. They will also look for areas without competitive rivals (a vacant niche), perhaps best done by placing both the (1) ideal points and (2) competing products on the same map.
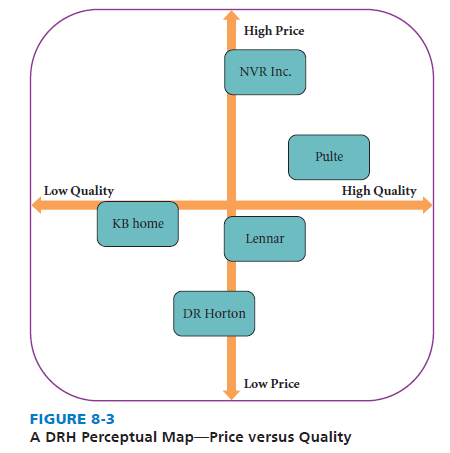
Companies commonly develop several perceptual maps to better understand competitive advantages and disadvantages versus rival companies. For example, the largest homebuilder in the United States, D. R. Horton (DRH), competes with Pulte, Lennar, KB Home, and other homebuilders. Figures 8-3, 8-4, and 8-5 reveal recently developed D. R. Horton perceptual maps. Note the author commentary provided for each illustration.
1. Author Commentary
Author commentary on FiGuRE 8-3 Price versus Quality is used in a perceptual map because these two factors are often viewed as the most important considerations when purchasing a home. The average sale price per DRH home is lower than any other major homebuilders in the United States, which is why they are the lowest on the perceptual map. Oftentimes, however, being the low-cost provider can mean actual, or perceived, low quality. The map reveals that DRH is above only KB Home in quality. Quality was determined through interpreting online ratings of the companies, as well as reviewing all of the competitor’s websites for proof that quality was being provided. Note that Lennar is the closet to DRH on the Price versus Quality perceptual map.
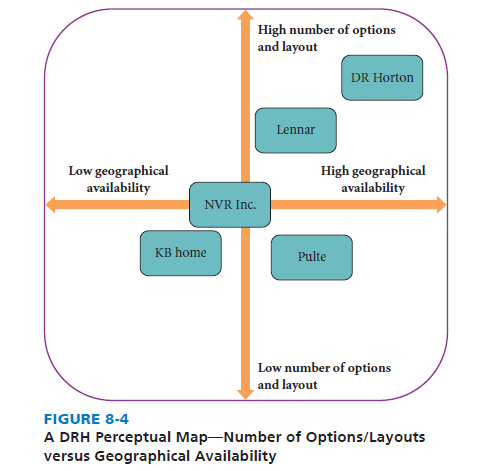
author commentary on figure 8-4 When buying or building a new home, consumers not only want to make sure it can be built where they want it but also with the layout or options they desire. By comparing coverage maps of the largest homebuilders in the United States, it was concluded that DRH has the highest geographical coverage of all the competitors. Additionally, through a review of the homebuilder’s websites, it was determined that DRH has the largest quantity of options and layouts for new homes. Neither of these facts should come as a surprise, as DRH does hold the title of “Largest Home Builder in the USA.” Rival firms are placed accordingly on the perceptual map. Note that Lennar is the closest to DRH on the Number of Options and Layouts versus Geographical Coverage perceptual map.
2. Author commentary on figure 8-5
Consumers increasingly are concerned with what and from whom they are purchasing. Thus, customer service and green conscientiousness are often key factors considered by consumers. After examining online ratings of the largest homebuilders and reviewing competitor’s websites, it was determined that DRH has, at best, average customer service. There were numerous complaints at several websites, and not very many resolutions, or ways to find resolutions. Furthermore, through a review of the competitors’ websites, it appears that DRH is the least green conscientious builder among the major players. It had very little, if any, mention of green considerations, whereas some firms had very involved and detailed sections on their web pages about green building. Note that Lennar is the closest to DRH on the Quality of Customer Service versus Extent the Firm is Green Conscientious perceptual map.
Source: David Fred, David Forest (2016), Strategic Management: A Competitive Advantage Approach, Concepts and Cases, Pearson (16th Edition).
18 May 2021
17 May 2021
18 May 2021
17 May 2021
18 May 2021
17 May 2021