Other than ranking strategies to achieve the prioritized list, there is only one analytical technique in the literature designed to determine the relative attractiveness of feasible alternative actions. The Quantitative Strategic Planning Matrix (QSPM), which comprises Stage 3 of the strategy-formulation analytical framework, objectively indicates which alternative strategies are best.6 The QSPM uses input from Stage 1 analyses and matching results from Stage 2 analyses to decide objectively among alternative strategies. That is, the EFE Matrix, IFE Matrix, and CPM that comprise Stage 1, coupled with the SWOT Matrix, SPACE Matrix, BCG Matrix, IE Matrix, and Grand Strategy Matrix that comprise Stage 2, provide the needed information for setting up the QSPM (Stage 3). The QSPM is a tool that allows strategists to evaluate alternative strategies objectively, based on previously identified external and internal key success factors. Like other strategy-formulation analytical tools, the QSPM requires assignment of ratings (called attractiveness scores), but making “small” rating decisions enables strategists to make effective “big” decisions, such as which country to spend a billion dollars in to sell a product.
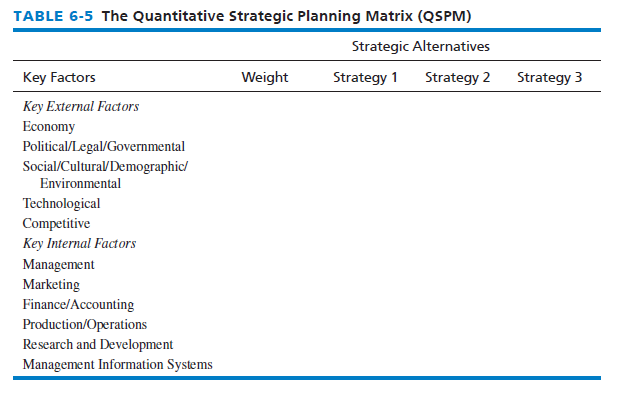
The basic format of the QSPM is illustrated in Table 6-5. Note that the left column of a QSPM consists of key external and internal factors (from Stage 1), and the top row consists of feasible alternative strategies (from Stage 2). Specifically, the left column of a QSPM consists of information obtained directly from the EFE Matrix and IFE Matrix. In a column adjacent to the key success factors, the respective weights received by each factor in the EFE Matrix and the IFE Matrix are recorded.
The top row of a QSPM consists of alternative strategies derived from the SWOT Matrix, SPACE Matrix, BCG Matrix, IE Matrix, and Grand Strategy Matrix. These matching tools usually generate similar feasible alternatives. However, not every strategy suggested by the matching techniques has to be evaluated in a QSPM. Strategists should compare several viable alternative strategies in a QSPM. Make sure your strategies are stated in specific terms, such as “Open 275 new stores in Indonesia” rather than “Expand globally” or “Open new stores in Africa.” Ultimately, a dollar value must be established for each recommended strategy; it would be impossible to establish a dollar value for “expand globally.”
Conceptually, the QSPM determines the relative attractiveness of various strategies based on the extent that key external and internal factors are capitalized on or improved. The relative attractiveness of each strategy within a set of alternatives is computed by determining the cumulative impact of each external and internal factor. Any number of sets of alternative strategies can be included in the QSPM, and any number of strategies can make up a given set, but only strategies within a given set are evaluated relative to each other. For example, one set of strategies may include diversification, whereas another set may include issuing stock and selling a division to raise needed capital. These two sets of strategies are totally different, and the QSPM evaluates strategies only within sets. Note in Table 6-5 that three strategies are included, and they make up just one set.
A Quantitative Strategic Planning Matrix for a retail computer store is provided in Table 6-6. This example illustrates all the components of the QSPM: strategic alternatives, key factors, weights, attractiveness scores (AS), total attractiveness scores (TAS), and the sum total attractiveness score. The three new terms just introduced—(1) attractiveness scores, (2) total attractiveness scores, and (3) the sum total attractiveness score—are defined and explained as the six steps required to develop a QSPM are discussed:
- Step 1 : Make a list of the firm’s key external opportunities and threats and internal strengths and weaknesses in the left column of the QSPM. This information should be taken directly from the EFE Matrix and IFE Matrix. (The Excel template at www.strategyclub.com can facilitate this process.)
- Step 2: Assign weights to each key external and internal factor. These weights are identical to those in the EFE Matrix and IFE Matrix. The weights are presented in a straight column just to the right of the external and internal factors.
- Step 3: Examine the Stage 2 (matching) matrices, and identify alternative strategies that the organization should consider implementing. Record these strategies in the top row of the QSPM. Group the strategies into mutually exclusive sets if possible.
- Step 4: Determine the Attractiveness Scores (AS), defined as numerical values that indicate the relative attractiveness of each strategy considering a single external or internal factor. Attractiveness Scores (AS) are determined by examining each key external or internal factor, one at a time, and asking the question, “Does this factor affect the choice of strategies being made?” If the answer to this question is yes, then the strategies should be compared relative to that key factor. Specifically, AS should be assigned to each strategy to indicate the relative attractiveness of one strategy over others, considering the particular factor. The range for AS is 1 = not attractive, 2 = somewhat attractive, 3 = reasonably attractive, and 4 = highly attractive. By “attractive,” we mean the extent that one strategy, compared to others, enables the firm to either capitalize on the strength, improve on the weakness, exploit the opportunity, or avoid the threat. Work row by row in developing a QSPM. If the answer to the previous question is no, indicating that the respective key factor has no effect on the specific choice being made, then do not assign AS to the strategies in that set. Use a dash to indicate that the key factor does not affect the choice being made. Note: If you assign an AS score to one strategy, then assign an AS score(s) to the other—in other words, if one strategy receives a dash—then all others must receive a dash in a given row. Also, in the Excel template provided at www. strategyclub.com, zeros are used instead of dashes.
- Step 5: Compute the Total Attractiveness Scores. Total Attractiveness Scores (TAS) are defined as the product of multiplying the weights (Step 2) by the AS (Step 4 )in each row. The TAS indicate the relative attractiveness of each alternative strategy, considering only the impact of the adjacent external or internal critical success factor. The higher the TAS, the more attractive the strategic alternative (considering only the adjacent critical success factor).
- Step 6: Compute the Sum Total Attractiveness Score. Add TAS in each strategy column of the QSPM. The Sum Total Attractiveness Scores (STAS) reveal which strategy is most attractive in each set of alternatives. Higher scores indicate more attractive strategies, considering all the relevant external and internal factors that could affect the strategic decisions. The magnitude of the difference between the STAS in a given set of strategic alternatives indicates the relative desirability of one strategy over another.
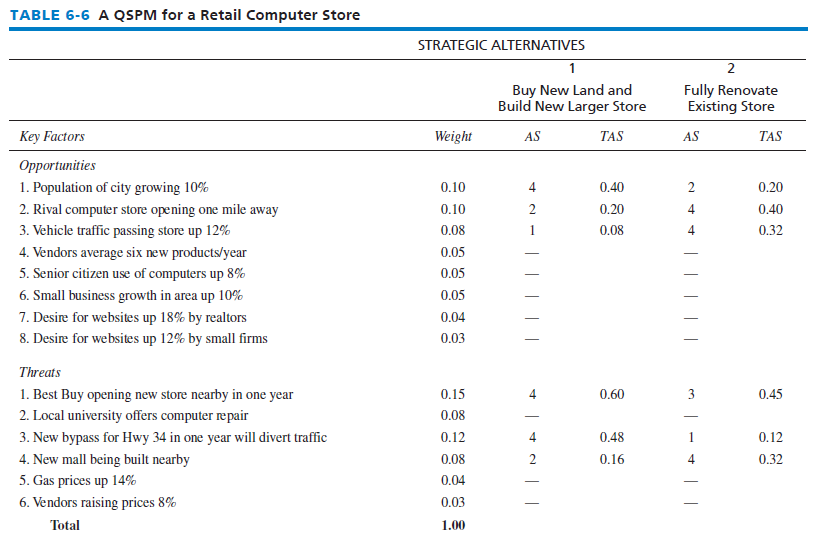

In Table 6-6, two alternative strategies—(1) buy new land and build new larger store and (2) fully renovate existing store—are being considered by a computer retail store. Note by the Sum Total Attractiveness Scores of 3.64 versus 3.27 that the analysis indicates the business should buy new land and build a new larger store. Note the use of dashes to indicate which factors do not affect the strategy choice being considered. If a particular factor affects one strategy, but not the other, it affects the choice being made, so AS should be recorded for both strategies. Never rate one strategy and not the other. Note also in Table 6-6 that there are no consecutive 1s, 2s, 3 s, or 4s across any row in a QSPM; never assign the same AS score across a row. Always prepare a QSPM working row by row. Also, if you have more than one strategy in the QSPM, then let the AS scores range from 1 to “the number of strategies being evaluated.” This will enable you to have a different AS score for each strategy. These are all important guidelines to follow in developing a QSPM. In actual practice, the store did purchase the new land and build a new store; the business also did some minor refurbishing until the new store was operational.
There should be a rationale for each AS score assigned. Note in the first row of Table 6-6 that the “Population of city growing 10 percent” opportunity could be capitalized on best by Strategy 1, “Buy New Land and Build New, Larger Store,” so an AS score of 4 was assigned to Strategy 1. Attractiveness Scores, therefore, are not mere guesses; they should be rational, defensible, and reasonable. Mathematically, the AS score of 4 in row 1 suggests Strategy 1 is 100 percent more attractive than Strategy 2, whose AS score was 2 (since 4 – 2 = 2 and 2 divided by 2 = 100 percent).
Positive Features and Limitations of the QSPM
A positive feature of the QSPM is that sets of strategies can be examined sequentially or simultaneously. For example, corporate-level strategies could be evaluated first, followed by division-level strategies, and then function-level strategies. There is no limit to the number of strategies that can be evaluated or the number of sets of strategies that can be examined at once using the QSPM.
Another positive feature of the QSPM is that it requires strategists to integrate pertinent external and internal factors into the decision process. Developing a Quantitative Strategic Planning Matrix makes it less likely that key factors will be overlooked or weighted inappropriately. It draws attention to important relationships that affect strategy decisions. Although developing a QSPM requires Attractiveness Scores (AS) decisions, those small decisions enhance the probability that the final strategic decisions will be best for the organization. A QSPM can be used by small and large, for-profit and nonprofit organizations.7
The Quantitative Strategic Planning Matrix has two limitations. First, it always requires informed judgments regarding AS scores, but quantification is helpful throughout the strategic- planning process to minimize halo error and various biases. Attractiveness Scores are not mere guesses. Be reminded that a 4 is 33 percent more important than a 3; making good small decisions is important for making good big decisions, such as deciding among various strategies to implement. Second, a limitation of the QSPM is that it can be only as good as the prerequisite information and matching analyses on which it is based.
Source: David Fred, David Forest (2016), Strategic Management: A Competitive Advantage Approach, Concepts and Cases, Pearson (16th Edition).
I was recommended this website by way of my cousin. I’m now not certain whether or not this put up is written by means of him as no one else understand such particular approximately my problem. You’re incredible! Thanks!