There are three major types of attitudinal scale:
- the summated rating scale, also known as the Likert scale;
- the equal-appearing interval scale or differential scale, also known as the Thurstone scale;
- the cumulative scale, also known as the Guttman scale.
1. The summated rating or Likert scale
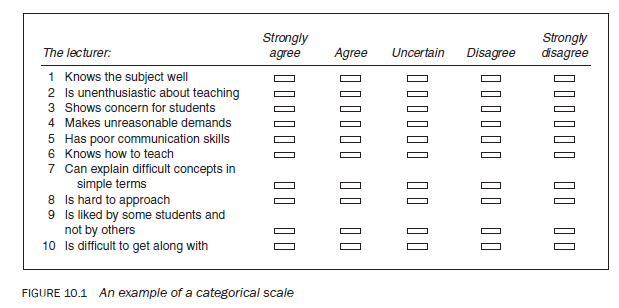
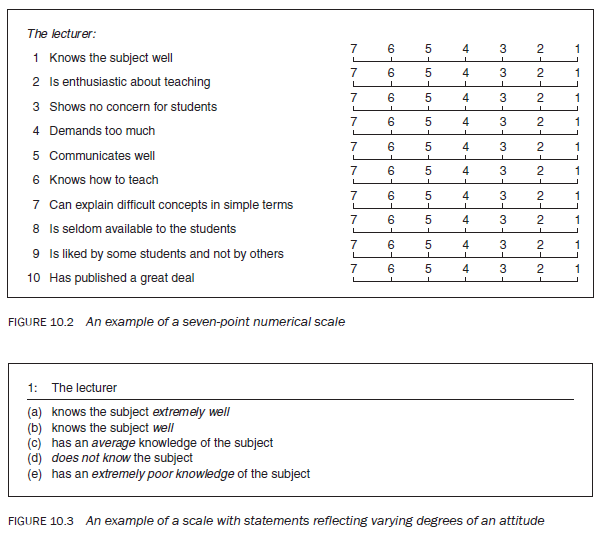
The summated rating scale, more commonly known as the Likert scale, is based upon the assumption that each statement/item on the scale has equal attitudinal value, ‘importance’ or ‘weight’ in terms of reflecting an attitude towards the issue in question. This assumption is also the main limitation of this scale as statements on a scale seldom have equal attitudinal value. For instance, in the examples in Figures 10.1 and 10.2, ‘knowledge of subject’ is not as important in terms of the degree to which it reflects the attitude of the students towards the lecturer as ‘has published a great deal’ or ‘some students like, some do not’, but, on the Likert scale, each is treated as having the same ‘weight’. A student may not bother much about whether a lecturer has published a great deal, but may be more concerned about ‘knowledge of the subject’, ‘communicates well’ and ‘knows how to teach’.
It is important to remember that the Likert scale does not measure attitude per se. It does help to place different respondents in relation to each other in terms of the intensity of their attitude towards an issue: it shows the strength of one respondent’s view in relation to that of another and not the absolute attitude.
1.1. Considerations in constructing a Likert scale
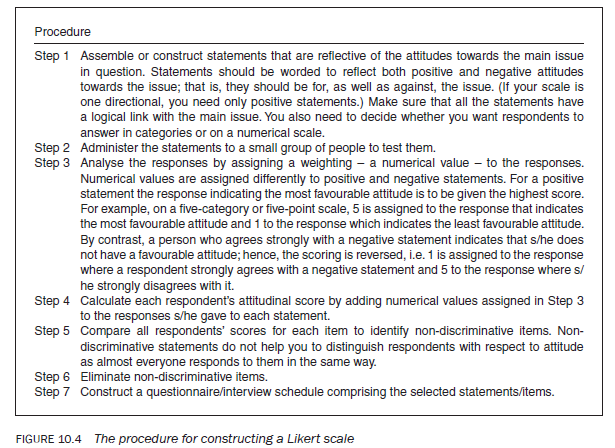
In developing a Likert scale, there are a number of things to consider. Firstly, decide whether the attitude to be measured is to be classified into one-, two- or three-directional categories (i.e. whether you want to determine positive, negative and neutral positions in the study population) with respect to their attitude towards the issue under study. Next, consider whether you want to use categories or a numerical scale. This should depend upon whether you think that your study population can express itself better on a numerical scale or in categories. The decision about the number of points or the number of categories on a categorical scale depends upon how finely you want to measure the intensity of the attitude in question and on the capacity of the population to make fine distinctions. Figure 10.1 shows a five-point categorical scale that is three directional and Figure 10.2 illustrates a seven-point numerical scale that is one directional. Sometimes you can also develop statements reflecting opinion about an issue in varying degrees (Figure 10.3). In this instance a respondent is asked to select the statement which best describes the opinion.
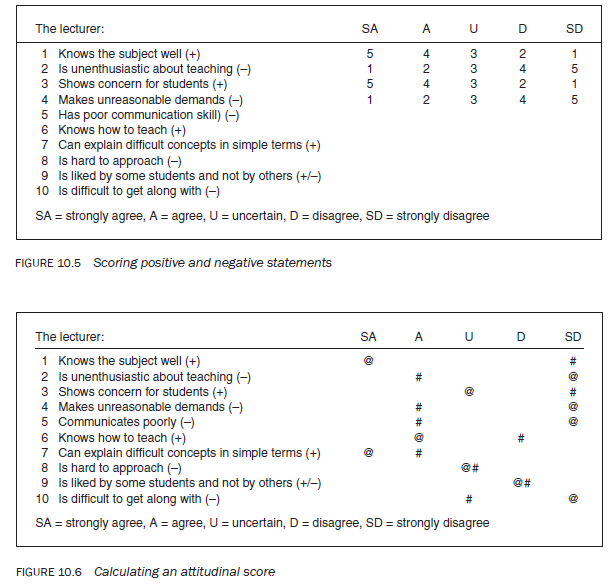
1.2. The procedure for constructing a Likert scale
Figure 10.4 shows the procedure used in constructing a Likert scale.
1.3. Calculating attitudinal scores
Suppose you have developed a questionnaire/interview schedule to measure the attitudes of a class of students towards their lecturer using a scale with five categories.
In Figure 10.5, statement 1 is a positive statement; hence, if a respondent ticks ‘strongly agree’, s/he is assumed to have a more positive attitude on this item than a person who ticks ‘agree’. The person who ticks ‘agree’ has a more positive attitude than a person who ticks ‘uncertain’, and so on. Therefore, a person who ticks ‘strongly agree’ has the most positive attitude compared with all of the others with different responses. Hence, the person is given the highest score, 5, as there are only five response categories. If there were four categories you could assign a score of 4. As a matter of fact, any score can be assigned as long as the intensity of the response pattern is reflected in the score and the highest score is assigned to the response with the highest intensity.
Statement 2 is a negative statement. In this case a person who ticks ‘strongly disagree’ has the most positive attitude on this item; hence, the highest score is assigned, 5. On the other hand, a respondent who ticks ‘strongly agree’ has the least positive attitude on the item and therefore is assigned the lowest score, 1. The same scoring system is followed for the other statements.
Note statement 9. There will always be some people who like a lecturer and some who do not; hence, this type of statement is neutral. There is no point in including such items in the scale but, here, for the purpose of this example, we have.
To illustrate how to calculate an individual’s attitudinal score, let us take the example of two respondents who have ticked the different statements marked in our example by # and @ (see Figure 10.6).
Let us work out their attitudinal score:
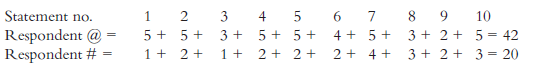
The analysis shows that, overall, respondent @ has a ‘more’ positive attitude towards the lecturer than respondent #. You cannot say that the attitude of respondent @ is twice (42/20 = 2.10) as positive as that of respondent #. The attitudinal score only places respondents in a position relative to one another. Remember that the Likert scale does not measure the attitude per se, but helps you to rate a group of individuals in descending or ascending order with respect to their attitudes towards the issues in question.
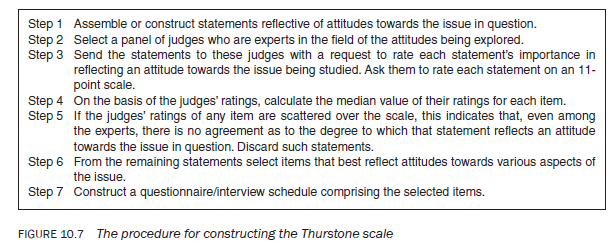
2. The equal-appearing interval or Thurstone scale
Unlike the Likert scale, the Thurstone scale calculates a ‘weight’ or ‘attitudinal value’ for each statement. The weight (equivalent to the median value) for each statement is calculated on the basis of rating assigned by a group of judges. Each statement with which respondents express agreement (or to which they respond in the affirmative) is given an attitudinal score equivalent to the ‘attitudinal value’ of the statement. The procedure for constructing the Thurstone scale is as given in Figure 10.7.
The main advantage of this scale is that, as the importance of each statement is determined by judges, it reflects the absolute rather than relative attitudes of respondents. The scale is thus able to indicate the intensity of people’s attitudes and any change in this intensity should the study be replicated. On the other hand, the scale is difficult to construct, and a major criticism is that judges and respondents may assess the importance of a particular statement differently and, therefore, the respondents’ attitudes might not be reflected.
3. The cumulative or Guttman scale
The Guttman scale is one of the most difficult scales to construct and therefore is rarely used. This scale does not have much relevance for beginners in research and so is not discussed in this book.
Source: Kumar Ranjit (2012), Research methodology: a step-by-step guide for beginners, SAGE Publications Ltd; Third edition.
Everything is very open and very clear explanation of issues. was truly information. Your website is very useful. Thanks for sharing.