Businesses use their databases to keep track of basic transactions, such as paying suppliers, processing orders, keeping track of customers, and paying employees. But they also need databases to provide information that will help the company run the business more efficiently and help managers and employees make better decisions. If a company wants to know which product is the most popular or who is its most profitable customer, the answer lies in the data.
1. The Challenge of Big Data
Most data collected by organizations used to be transaction data that could easily fit into rows and columns of relational database management systems. We are now witnessing an explosion of data from web traffic, email messages, and social media content (tweets, status messages), as well as machine-generated data from sensors (used in smart meters, manufacturing sensors, and electrical meters) or from electronic trading systems. These data may be unstructured or semi-structured and thus not suitable for relational database products that organize data in the form of columns and rows. We now use the term big data to describe these data sets with volumes so huge that they are beyond the ability of typical DBMS to capture, store, and analyze.
Big data is often characterized by the “3Vs”: the extreme volume of data, the wide variety of data types and sources, and the velocity at which data must be processed. Big data doesn’t designate any specific quantity but usually refers to data in the petabyte and exabyte range—in other words, billions to trillions of records, many from different sources. Big data are produced in much larger quantities and much more rapidly than traditional data. For example, a single jet engine is capable of generating 10 terabytes of data in just 30 minutes, and there are more than 25,000 airline flights each day. Twitter generates more than 8 terabytes of data daily. According to the International Data Center (IDC) technology research firm, data are more than doubling every two years, so the amount of data available to organizations is skyrocketing.
Businesses are interested in big data because they can reveal more patterns and interesting relationships than smaller data sets, with the potential to provide new insights into customer behavior, weather patterns, financial market activity, or other phenomena. For example, Shutterstock, the global online image marketplace, stores 24 million images, adding 10,000 more each day. To find ways to optimize the buying experience, Shutterstock analyzes its big data to find out where its website visitors place their cursors and how long they hover over an image before making a purchase. Big data is also finding many uses in the public sector, For example, city governments have been using big data to manage traffic flows and to fight crime.
However, to derive business value from these data, organizations need new technologies and tools capable of managing and analyzing nontraditional data along with their traditional enterprise data. They also need to know what questions to ask of the data and limitations of big data. Capturing, storing, and analyzing big data can be expensive, and information from big data may not necessarily help decision makers. It’s important to have a clear understanding of the problem big data will solve for the business. The chapter-ending case explores these issues.
2. Business Intelligence Infrastructure
Suppose you wanted concise, reliable information about current operations, trends, and changes across the entire company. If you worked in a large company, the data you need might have to be pieced together from separate systems, such as sales, manufacturing, and accounting, and even from external sources, such as demographic or competitor data. Increasingly, you might need to use big data. A contemporary infrastructure for business intelligence has an array of tools for obtaining useful information from all the different types of data used by businesses today, including semi-structured and unstructured big data in vast quantities. These capabilities include data warehouses and data marts, Hadoop, in-memory computing, and analytical platforms. Some of these capabilities are available as cloud services.
2.1. Data Warehouses and Data Marts
The traditional tool for analyzing corporate data for the past two decades has been the data warehouse. A data warehouse is a database that stores current and historical data of potential interest to decision makers throughout the company. The data originate in many core operational transaction systems, such as systems for sales, customer accounts, and manufacturing, and may include data from website transactions. The data warehouse extracts current and historical data from multiple operational systems inside the organization. These data are combined with data from external sources and transformed by correcting inaccurate and incomplete data and restructuring the data for management reporting and analysis before being loaded into the data warehouse.
The data warehouse makes the data available for anyone to access as needed, but the data cannot be altered. A data warehouse system also provides a range of ad hoc and standardized query tools, analytical tools, and graphical reporting facilities.
Companies often build enterprise-wide data warehouses, where a central data warehouse serves the entire organization, or they create smaller, decentralized warehouses called data marts. A data mart is a subset of a data warehouse in which a summarized or highly focused portion of the organization’s data is placed in a separate database for a specific population of users. For example, a company might develop marketing and sales data marts to deal with customer information. Bookseller Barnes & Noble used to maintain a series of data marts—one for point-of-sale data in retail stores, another for college bookstore sales, and a third for online sales.
2.2. Hadoop
Relational DBMS and data warehouse products are not well suited for organizing and analyzing big data or data that do not easily fit into columns and rows used in their data models. For handling unstructured and semi-structured data in vast quantities, as well as structured data, organizations are using Hadoop. Hadoop is an open source software framework managed by the Apache Software Foundation that enables distributed parallel processing of huge amounts of data across inexpensive computers. It breaks a big data problem down into subproblems, distributes them among up to thousands of inexpensive computer processing nodes, and then combines the result into a smaller data set that is easier to analyze. You’ve probably used Hadoop to find the best airfare on the Internet, get directions to a restaurant, do a search on Google, or connect with a friend on Facebook.
Hadoop consists of several key services, including the Hadoop Distributed File System (HDFS) for data storage and MapReduce for high-performance parallel data processing. HDFS links together the file systems on the numerous nodes in a Hadoop cluster to turn them into one big file system. Hadoop’s MapReduce was inspired by Google’s MapReduce system for breaking down processing of huge data sets and assigning work to the various nodes in a cluster. HBase, Hadoop’s non-relational database, provides rapid access to the data stored on HDFS and a transactional platform for running high-scale real-time applications.
Hadoop can process large quantities of any kind of data, including structured transactional data, loosely structured data such as Facebook and Twitter feeds, complex data such as web server log files, and unstructured audio and video data. Hadoop runs on a cluster of inexpensive servers, and processors can be added or removed as needed. Companies use Hadoop for analyzing very large volumes of data as well as for a staging area for unstructured and semi-structured data before they are loaded into a data warehouse. Yahoo uses Hadoop to track users’ behavior so it can modify its home page to fit their interests. Life sciences research firm NextBio uses Hadoop and HBase to process data for pharmaceutical companies conducting genomic research. Top database vendors such as IBM, Hewlett-Packard, Oracle, and Microsoft have their own Hadoop software distributions. Other vendors offer tools for moving data into and out of Hadoop or for analyzing data within Hadoop.
2.3. In-Memory Computing
Another way of facilitating big data analysis is to use in-memory computing, which relies primarily on a computer’s main memory (RAM) for data storage. (Conventional DBMS use disk storage systems.) Users access data stored in system primary memory, thereby eliminating bottlenecks from retrieving and reading data in a traditional, disk-based database and dramatically shortening query response times. In-memory processing makes it possible for very large sets of data, amounting to the size of a data mart or small data warehouse, to reside entirely in memory. Complex business calculations that used to take hours or days are able to be completed within seconds, and this can even be accomplished using handheld devices.
The previous chapter describes some of the advances in contemporary computer hardware technology that make in-memory processing possible, such as powerful high-speed processors, multicore processing, and falling computer memory prices. These technologies help companies optimize the use of memory and accelerate processing performance while lowering costs.
Leading in-memory database products include SAP HANA, Oracle Database In-Memory, and Teradata Intelligent Memory. The chapter-opening case on the Charlotte Hornets and the Interactive Session on the Kraft Company show how organizations are benefiting from in-memory technology.
2.4. Analytic Platforms
Commercial database vendors have developed specialized high-speed analytic platforms using both relational and non-relational technology that are optimized for analyzing large data sets. Analytic platforms feature preconfigured hardware-software systems that are specifically designed for query processing and analytics. For example, the IBM PureData System for Analytics features tightly integrated database, server, and storage components that handle complex analytic queries 10 to 100 times faster than traditional systems.
Analytic platforms also include in-memory systems and NoSQL non-relational database management systems and are now available as cloud services.
Figure 6.13 illustrates a contemporary business intelligence technology infrastructure using the technologies we have just described. Current and historical data are extracted from multiple operational systems along with web data, social media data, Internet of Things (IoT) machine-generated data, unstructured audio/visual data, and other data from external sources. Some companies are starting to pour all of these types of data into a data lake. A data lake is a repository for raw unstructured data or structured data that for the most part has not yet been analyzed, and the data can be accessed in many ways. The data lake stores these data in their native format until they are needed. The Hadoop Distributed File System (HDFS) is often used to store the data lake contents across a set of clustered computer nodes, and Hadoop clusters may be used to pre-process some of these data for use in the data warehouse, data marts, or an analytic platform, or for direct querying by power users. Outputs include reports and dashboards as well as query results. Chapter 12 discusses the various types of BI users and BI reporting in greater detail.
3. Analytical Tools: Relationships, Patterns, Trends
Once data have been captured and organized using the business intelligence technologies we have just described, they are available for further analysis using software for database querying and reporting, multidimensional data analysis (OLAP), and data mining. This section will introduce you to these tools, with more detail about business intelligence analytics and applications in Chapter 12.

3.1. Online Analytical Processing (OLAP)
Suppose your company sells four different products—nuts, bolts, washers, and screws—in the East, West, and Central regions. If you wanted to ask a fairly straightforward question, such as how many washers were sold during the past quarter, you could easily find the answer by querying your sales database. But what if you wanted to know how many washers were sold in each of your sales regions and compare actual results with projected sales?
To obtain the answer, you would need online analytical processing (OLAP). OLAP supports multidimensional data analysis, enabling users to view the same data in different ways using multiple dimensions. Each aspect of information—product, pricing, cost, region, or time period—represents a different dimension. So, a product manager could use a multidimensional data analysis tool to learn how many washers were sold in the East in June, how that compares with the previous month and the previous June, and how it compares with the sales forecast. OLAP enables users to obtain online answers to ad hoc questions such as these in a fairly rapid amount of time, even when the data are stored in very large databases, such as sales figures for multiple years.
Figure 6.14 shows a multidimensional model that could be created to represent products, regions, actual sales, and projected sales. A matrix of actual sales can be stacked on top of a matrix of projected sales to form a cube with six faces. If you rotate the cube 90 degrees one way, the face showing will be product versus actual and projected sales. If you rotate the cube 90 degrees again, you will see region versus actual and projected sales. If you rotate 180 degrees from the original view, you will see projected sales and product versus region.
Cubes can be nested within cubes to build complex views of data. A company would use either a specialized multidimensional database or a tool that creates multidimensional views of data in relational databases.
3.2. Data Mining
Traditional database queries answer such questions as “How many units of product number 403 were shipped in February 2018?” OLAP, or multidimensional analysis, supports much more complex requests for information, such as “Compare sales of product 403 relative to plan by quarter and sales region for the past two years.” With OLAP and query-oriented data analysis, users need to have a good idea about the information for which they are looking.
Data mining is more discovery-driven. Data mining provides insights into corporate data that cannot be obtained with OLAP by finding hidden patterns and relationships in large databases and inferring rules from them to predict future behavior. The patterns and rules are used to guide decision making and forecast the effect of those decisions. The types of information obtainable from data mining include associations, sequences, classifications, clusters, and forecasts.
- Associations are occurrences linked to a single event. For instance, a study of supermarket purchasing patterns might reveal that, when corn chips are purchased, a cola drink is purchased 65 percent of the time, but when there is a promotion, cola is purchased 85 percent of the time. This information helps managers make better decisions because they have learned the profitability of a promotion.
- In sequences, events are linked over time. We might find, for example, that if a house is purchased, a new refrigerator will be purchased within two weeks 65 percent of the time, and an oven will be bought within one month of the home purchase 45 percent of the time.
- Classification recognizes patterns that describe the group to which an item belongs by examining existing items that have been classified and by inferring a set of rules. For example, businesses such as credit card or telephone companies worry about the loss of steady customers. Classification helps discover the characteristics of customers who are likely to leave and can provide a model to help managers predict who those customers are so that the managers can devise special campaigns to retain such customers.
- Clustering works in a manner similar to classification when no groups have yet been defined. A data mining tool can discover different groupings within data, such as finding affinity groups for bank cards or partitioning a database into groups of customers based on demographics and types of personal investments.
- Although these applications involve predictions, forecasting uses predictions in a different way. It uses a series of existing values to forecast what other values will be. For example, forecasting might find patterns in data to help managers estimate the future value of continuous variables, such as sales figures.
These systems perform high-level analyses of patterns or trends, but they can also drill down to provide more detail when needed. There are data mining applications for all the functional areas of business and for government and scientific work. One popular use for data mining is to provide detailed analyses of patterns in customer data for one-to-one marketing campaigns or for identifying profitable customers.
Caesars Entertainment, formerly known as Harrah’s Entertainment, is the largest gaming company in the world. It continually analyzes data about its customers gathered when people play its slot machines or use its casinos and hotels. The corporate marketing department uses this information to build a detailed gambling profile, based on a particular customer’s ongoing value to the company. For instance, data mining lets Caesars know the favorite gaming experience of a regular customer at one of its riverboat casinos along with that person’s preferences for room accommodations, restaurants, and entertainment. This information guides management decisions about how to cultivate the most profitable customers, encourage those customers to spend more, and attract more customers with high revenue-generating potential. Business intelligence improved Caesars’s profits so much that it became the centerpiece of the firm’s business strategy.
3.3. Text Mining and Web Mining
Unstructured data, most in the form of text files, is believed to account for more than 80 percent of useful organizational information and is one of the major sources of big data that firms want to analyze. Email, memos, call center transcripts, survey responses, legal cases, patent descriptions, and service reports are all valuable for finding patterns and trends that will help employees make better business decisions. Text mining tools are now available to help businesses analyze these data. These tools are able to extract key elements from unstructured natural language text, discover patterns and relationships, and summarize the information.
Businesses might turn to text mining to analyze transcripts of calls to customer service centers to identify major service and repair issues or to measure customer sentiment about their company. Sentiment analysis software is able to mine text comments in an email message, blog, social media conversation, or survey forms to detect favorable and unfavorable opinions about specific subjects. For example, Kraft Foods uses a Community Intelligence Portal and sentiment analysis to tune into consumer conversations about its products across numerous social networks, blogs, and other websites. Kraft tries to make sense of relevant comments rather than just track brand mentions and can identify customers’ emotions and feelings when they talk about how they barbecue and what sauces and spices they use.
The web is another rich source of unstructured big data for revealing patterns, trends, and insights into customer behavior. The discovery and analysis of useful patterns and information from the World Wide Web are called web mining. Businesses might turn to web mining to help them understand customer behavior, evaluate the effectiveness of a particular website, or quantify the success of a marketing campaign. For instance, marketers use the Google Trends service, which tracks the popularity of various words and phrases used in Google search queries, to learn what people are interested in and what they are interested in buying.
Web mining looks for patterns in data through content mining, structure mining, and usage mining. Web content mining is the process of extracting knowledge from the content of web pages, which may include text, image, audio, and video data. Web structure mining examines data related to the structure of a particular website. For example, links pointing to a document indicate the popularity of the document, while links coming out of a document indicate the richness or perhaps the variety of topics covered in the document. Web usage mining examines user interaction data recorded by a web server whenever requests for a website’s resources are received. The usage data records the user’s behavior when the user browses or makes transactions on the website and collects the data in a server log. Analyzing such data can help companies determine the value of particular customers, cross-marketing strategies across products, and the effectiveness of promotional campaigns.
The chapter-ending case describes organizations’ experiences as they use the analytical tools and business intelligence technologies we have described to grapple with “big data” challenges.
4. Databases and the Web
Have you ever tried to use the web to place an order or view a product catalog? If so, you were using a website linked to an internal corporate database. Many companies now use the web to make some of the information in their internal databases available to customers and business partners.
Suppose, for example, a customer with a web browser wants to search an online retailer’s database for pricing information. Figure 6.15 illustrates how that customer might access the retailer’s internal database over the web. The user accesses the retailer’s website over the Internet using a web browser on his or her client PC or mobile device. The user’s web browser software requests data from the organization’s database, using HTML commands to communicate with the web server. Apps provide even faster access to corporate databases.
Because many back-end databases cannot interpret commands written in HTML, the web server passes these requests for data to software that translates HTML commands into SQL so the commands can be processed by the DBMS working with the database. In a client/server environment, the DBMS resides on a dedicated computer called a database server. The DBMS receives the SQL requests and provides the required data. Middleware transfers information from the organization’s internal database back to the web server for delivery in the form of a web page to the user.
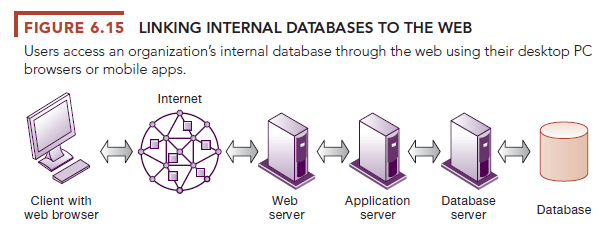
Figure 6.15 shows that the middleware working between the web server and the DBMS is an application server running on its own dedicated computer (see Chapter 5). The application server software handles all application operations, including transaction processing and data access, between browser-based computers and a company’s back-end business applications or databases. The application server takes requests from the web server, runs the business logic to process transactions based on those requests, and provides connectivity to the organization’s back-end systems or databases. Alternatively, the software for handling these operations could be a custom program or a CGI script. A CGI script is a compact program using the Common Gateway Interface (CGI) specification for processing data on a web server.
There are a number of advantages to using the web to access an organization’s internal databases. First, web browser software is much easier to use than proprietary query tools. Second, the web interface requires few or no changes to the internal database. It costs much less to add a web interface in front of a legacy system than to redesign and rebuild the system to improve user access.
Accessing corporate databases through the web is creating new efficiencies, opportunities, and business models. ThomasNet.com provides an up-to-date online directory of more than 500,000 suppliers of industrial products, such as chemicals, metals, plastics, rubber, and automotive equipment. Formerly called Thomas Register, the company used to send out huge paper catalogs with this information. Now it provides this information to users online via its website and has become a smaller, leaner company.
Other companies have created entirely new businesses based on access to large databases through the web. One is the social networking service Facebook, which helps users stay connected with each other and meet new people. Facebook features “profiles” with information on over 2.2 billion active users with information about themselves, including interests, friends, photos, and groups with which they are affiliated. Facebook maintains a very large database to house and manage all of this content. There are also many web-enabled databases in the public sector to help consumers and citizens access helpful information.
Source: Laudon Kenneth C., Laudon Jane Price (2020), Management Information Systems: Managing the Digital Firm, Pearson; 16th edition.
Very interesting points you have mentioned, thankyou for putting up.