Types of quantitative methods

Quantitative methods represent the steps of using the Scientific Method of research. There are following types of quantitative method…

1. Experimental Research is the most well-established quantitative methodology in both the physical and social sciences. This approach uses the principles of research in the physical sciences to conduct experiments that explore human behavior.

2. Survey Research is used to ask people a number of questions about particular topics. Surveys can be online, mailed, handed out, or conducted in interview format. After researchers have collected survey data, they represent participants’ responses in numerical form using tables, graphs, charts, and/or percentages.

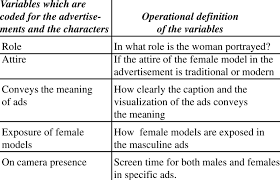
3. Content Analysis. Researchers use content analysis to count the number of occurrences of their particular focus of inquiry. Communication researchers often conduct content analyses of movies, commercials, television shows, magazines, etc., to count the number of occurrences of particular phenomena in these contexts to explore potential effects.

4. Meta-Analysis. Do you ever get frustrated when you hear about one research project that says a particular food is good for your health, and then some time later, you hear about another research project that says the opposite? Meta-analysis analyzes existing statistics found in a collection of quantitative research to demonstrate patterns in a particular line of research over time.

[blog_posts style=”push” col_spacing=”small” columns=”2″ columns__md=”1″ depth_hover=”2″ slider_nav_style=”simple” slider_bullets=”true” auto_slide=”8000″ ids=”8436,8604″ show_date=”false” excerpt_length=”0″ comments=”false” image_height=”56.25%” image_size=”original” image_hover=”zoom”]

[blog_posts style=”push” col_spacing=”small” columns=”3″ columns__md=”1″ depth_hover=”2″ slider_nav_style=”simple” slider_bullets=”true” auto_slide=”8000″ ids=”8476,8607,8596″ show_date=”false” excerpt_length=”0″ comments=”false” image_height=”56.25%” image_size=”original” image_hover=”zoom”]

Questionnaire survey for quantitative research

Survey vs Questionnaire: Differences and Definitions

A questionnaire is used to collect data from a list of questions. It’s not used to look for trends, behavior or a bigger picture. A survey is data collection through a set of questions for the purposes of statistical analysis

To put it simply – a questionnaire is a list of written questions aimed at getting information about individuals. A questionnaire is usually limited in scope, and it isn’t used for gathering data or analyzing statistics.

A survey involves gathering data to use for analysis and forecasting. As opposed to its questionnaire cousin, the data isn’t analyzed in isolation. Surveys do look for trends, behavior, and the bigger picture.

Here’s another way to put it: A questionnaire is one-purpose data collection through a set of questions. A survey is data collection through a set of questions for the purposes of statistical analysis.

The definition of a questionnaire

Here’s an example of a questionnaire. Flashback to the last time you joined a gym, maybe you went for a health check when you signed up. You would have been asked to answer a list of specific questions about medical history.

That was a questionnaire. The information you provided is used to assess risk, help with diagnoses and paint a picture of your medical history. It’s not used to look for trends, behavior or a bigger picture.

The definition of a survey

Think of a survey as a major project, aimed at using data to reach informed conclusions. Yes, that’s right – a survey could be regarded as a questionnaire on steroids.

With a survey, you can dig deeper and find out peoples’ opinions and ideas. You can ask demographic survey questions, you can find out how engaged your employees are, or you can do market research. And much more.

[title text=”Main contents” link_text=”See more from basic to advanced” link=”/category/methodology/quantitative-research/quantitative-research-methods/questionnaire-survey/”]

[blog_posts style=”normal” col_spacing=”xsmall” columns=”3″ columns__md=”1″ depth_hover=”2″ auto_slide=”5000″ cat=”227″ posts=”3″ offset=”52″ show_date=”false” excerpt_length=”25″ comments=”false” image_height=”60%” image_size=”original” image_hover=”zoom” text_align=”left”]

[blog_posts style=”normal” col_spacing=”xsmall” columns=”3″ columns__md=”1″ depth_hover=”2″ auto_slide=”6000″ cat=”227″ posts=”3″ offset=”49″ show_date=”false” excerpt_length=”25″ comments=”false” image_height=”60%” image_size=”original” image_hover=”zoom” text_align=”left”]

[blog_posts style=”normal” col_spacing=”xsmall” columns=”3″ columns__md=”1″ depth_hover=”2″ auto_slide=”7000″ cat=”227″ posts=”6″ offset=”43″ show_date=”false” excerpt_length=”25″ comments=”false” image_height=”60%” image_size=”original” image_hover=”zoom” text_align=”left”]

[blog_posts style=”normal” col_spacing=”xsmall” columns=”3″ columns__md=”1″ depth_hover=”2″ auto_slide=”8000″ cat=”227″ posts=”6″ offset=”37″ show_date=”false” excerpt_length=”25″ comments=”false” image_height=”60%” image_size=”original” image_hover=”zoom” text_align=”left”]

[blog_posts style=”normal” col_spacing=”xsmall” columns=”3″ columns__md=”1″ depth_hover=”2″ auto_slide=”5000″ cat=”227″ posts=”6″ offset=”31″ show_date=”false” excerpt_length=”25″ comments=”false” image_height=”60%” image_size=”original” image_hover=”zoom” text_align=”left”]

[blog_posts style=”normal” col_spacing=”xsmall” columns=”3″ columns__md=”1″ depth_hover=”2″ auto_slide=”6000″ cat=”227″ posts=”6″ offset=”25″ show_date=”false” excerpt_length=”25″ comments=”false” image_height=”60%” image_size=”original” image_hover=”zoom” text_align=”left”]

[blog_posts style=”normal” col_spacing=”xsmall” columns=”3″ columns__md=”1″ depth_hover=”2″ auto_slide=”7000″ cat=”227″ posts=”6″ offset=”19″ show_date=”false” excerpt_length=”25″ comments=”false” image_height=”60%” image_size=”original” image_hover=”zoom” text_align=”left”]

[blog_posts style=”normal” col_spacing=”xsmall” columns=”3″ columns__md=”1″ depth_hover=”2″ auto_slide=”8000″ cat=”227″ posts=”6″ offset=”13″ show_date=”false” excerpt_length=”25″ comments=”false” image_height=”60%” image_size=”original” image_hover=”zoom” text_align=”left”]

[row style=”small” class=”form-lien-he”]

[col span=”2″ span__sm=”12″]

[/col]
[col span=”4″ span__sm=”12″]

[button text=”Home” color=”secondary” style=”gloss” radius=”5″ depth=”2″ depth_hover=”3″ expand=”true” icon=”icon-star” icon_pos=”left” link=”https://phantran.net/”]

[/col]
[col span=”4″ span__sm=”12″]

[button text=”See basic to advanced” style=”gloss” radius=”5″ depth=”2″ depth_hover=”3″ expand=”true” icon=”icon-checkmark” icon_pos=”left” link=”/category/methodology/quantitative-research/quantitative-research-methods/questionnaire-survey/”]

[/col]
[col span=”2″ span__sm=”12″]

[/col]

[/row]

Why do people mix up the two?

Well, it’s simple—they’re very similar. In fact, a big part of any survey involves a questionnaire. Marketing professionals and research specialists have always differentiated the two, but things have changed since the advent of the Internet. As more individuals and organizations started to manage their own research projects, the two terms became interchangeable.

“Survey” has become a synonym for “questionnaire”—and vice versa.

Now, just to dial your level of confusion up to 11, there’s also such a thing as a survey questionnaire. It starts as a simple questionnaire but later transforms into a survey—mindblown.

Imagine you’re trying to gauge how your employees feel about working with you. By using Likert Scale Questionnaires, you can ask people to express their feelings on a scale of, say, one to five. Then by aggregating the scores, you can get an overall picture of satisfaction levels within your organization.

Advantages of questionnaires include increased speed of data collection, low or no cost requirements, and higher levels of objectivity compared to many alternative methods of primary data collection. However, questionnaires have certain disadvantages such as selection of random answer choices by respondents without properly reading the question. Moreover, there is usually no possibility for respondents to express their additional thoughts about the matter due to the absence of a relevant question.

There are following types of questionnaires

Computer questionnaire. Respondents are asked to answer the questionnaire which is sent by mail. The advantages of the computer questionnaires include their inexpensive price, time-efficiency, and respondents do not feel pressured, therefore can answer when they have time, giving more accurate answers. However, the main shortcoming of the mail questionnaires is that sometimes respondents do not bother answering them and they can just ignore the questionnaire.

Telephone questionnaire. Researcher may choose to call potential respondents with the aim of getting them to answer the questionnaire. The advantage of the telephone questionnaire is that, it can be completed during the short amount of time. The main disadvantage of the phone questionnaire is that it is expensive most of the time. Moreover, most people do not feel comfortable to answer many questions asked through the phone and it is difficult to get sample group to answer questionnaire over the phone.

In-house survey. This type of questionnaire involves the researcher visiting respondents in their houses or workplaces. The advantage of in-house survey is that more focus towards the questions can be gained from respondents. However, in-house surveys also have a range of disadvantages which include being time consuming, more expensive and respondents may not wish to have the researcher in their houses or workplaces for various reasons.

Mail Questionnaire. This sort of questionnaires involve the researcher to send the questionnaire list to respondents through post, often attaching pre-paid envelope. Mail questionnaires have an advantage of providing more accurate answer, because respondents can answer the questionnaire in their spare time. The disadvantages associated with mail questionnaires include them being expensive, time consuming and sometimes they end up in the bin put by respondents.

Questionnaires can include the following types of questions:

Open question questionnaires. Open questions differ from other types of questions used in questionnaires in a way that open questions may produce unexpected results, which can make the research more original and valuable. However, it is difficult to analyze the results of the findings when the data is obtained through the questionnaire with open questions.

Multiple choice questions. Respondents are offered a set of answers they have to choose from. The downsize of questionnaire with multiple choice questions is that, if there are too many answers to choose from, it makes the questionnaire, confusing and boring, and discourages the respondent to answer the questionnaire.

Dichotomous Questions. This type of questions gives two options to respondents – yes or no, to choose from. It is the easiest form of questionnaire for the respondent in terms of responding it.

Scaling Questions. Also referred to as ranking questions, they present an option for respondents to rank the available answers to the questions on the scale of given range of values (for example from 1 to 10).

Survey Monkey represents one of the most popular online platforms for facilitating data collection through questionnaires. Substantial benefits offered by Survey Monkey include its ease to use, presentation of questions in many different formats and advanced data analysis capabilities.

Content Analysis Method and Examples

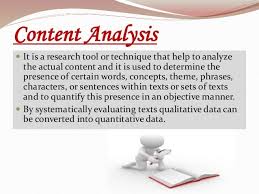
Content analysis is a research tool used to determine the presence of certain words, themes, or concepts within some given qualitative data (i.e. text). Using content analysis, researchers can quantify and analyze the presence, meanings and relationships of such certain words, themes, or concepts. As an example, researchers can evaluate language used within a news article to search for bias or partiality. Researchers can then make inferences about the messages within the texts, the writer(s), the audience, and even the culture and time of surrounding the text.

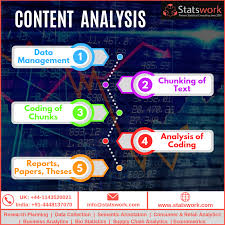
Sources of data could be from interviews, open-ended questions, field research notes, conversations, or literally any occurrence of communicative language (such as books, essays, discussions, newspaper headlines, speeches, media, historical documents). A single study may analyze various forms of text in its analysis. To analyze the text using content analysis, the text must be coded, or broken down, into manageable code categories for analysis (i.e. “codes”). Once the text is coded into code categories, the codes can then be further categorized into “code categories” to summarize data even further.

[title text=”Main contents” link_text=”See more from basic to advanced” link=”/category/methodology/qualitative-research/qualitative-methods/qualitative-contents-analysis/”]

[blog_posts style=”normal” col_spacing=”xsmall” columns=”3″ columns__md=”1″ depth_hover=”2″ auto_slide=”5000″ cat=”231″ posts=”3″ offset=”30″ show_date=”false” excerpt_length=”25″ comments=”false” image_height=”60%” image_size=”original” image_hover=”zoom” text_align=”left”]

[blog_posts style=”normal” col_spacing=”xsmall” columns=”3″ columns__md=”1″ depth_hover=”2″ auto_slide=”6000″ cat=”231″ posts=”3″ offset=”27″ show_date=”false” excerpt_length=”25″ comments=”false” image_height=”60%” image_size=”original” image_hover=”zoom” text_align=”left”]

[blog_posts style=”normal” col_spacing=”xsmall” columns=”3″ columns__md=”1″ depth_hover=”2″ auto_slide=”7000″ cat=”231″ posts=”6″ offset=”21″ show_date=”false” excerpt_length=”25″ comments=”false” image_height=”60%” image_size=”original” image_hover=”zoom” text_align=”left”]

[blog_posts style=”normal” col_spacing=”xsmall” columns=”3″ columns__md=”1″ depth_hover=”2″ auto_slide=”8000″ cat=”231″ posts=”6″ offset=”15″ show_date=”false” excerpt_length=”25″ comments=”false” image_height=”60%” image_size=”original” image_hover=”zoom” text_align=”left”]

[blog_posts style=”normal” col_spacing=”xsmall” columns=”3″ columns__md=”1″ depth_hover=”2″ auto_slide=”5000″ cat=”231″ posts=”6″ offset=”9″ show_date=”false” excerpt_length=”25″ comments=”false” image_height=”60%” image_size=”original” image_hover=”zoom” text_align=”left”]

[blog_posts style=”normal” col_spacing=”xsmall” columns=”3″ columns__md=”1″ depth_hover=”2″ auto_slide=”6000″ cat=”231″ posts=”6″ offset=”3″ show_date=”false” excerpt_length=”25″ comments=”false” image_height=”60%” image_size=”original” image_hover=”zoom” text_align=”left”]

[blog_posts style=”normal” col_spacing=”xsmall” columns=”3″ columns__md=”1″ depth_hover=”2″ auto_slide=”7000″ cat=”231″ posts=”3″ offset=”0″ show_date=”false” excerpt_length=”25″ comments=”false” image_height=”60%” image_size=”original” image_hover=”zoom” text_align=”left”]

[row style=”small” class=”form-lien-he”]

[col span=”2″ span__sm=”12″]

[/col]
[col span=”4″ span__sm=”12″]

[button text=”Home” color=”secondary” style=”gloss” radius=”5″ depth=”2″ depth_hover=”3″ expand=”true” icon=”icon-star” icon_pos=”left” link=”https://phantran.net/”]

[/col]
[col span=”4″ span__sm=”12″]

[button text=”See basic to advanced” style=”gloss” radius=”5″ depth=”2″ depth_hover=”3″ expand=”true” icon=”icon-checkmark” icon_pos=”left” link=”/category/methodology/qualitative-research/qualitative-methods/qualitative-contents-analysis/”]

[/col]
[col span=”2″ span__sm=”12″]

[/col]

[/row]

Quantitative content analysis highlights frequency counts and objective analysis of these coded frequencies. Additionally, quantitative content analysis begins with a framed hypothesis with coding decided on before the analysis begins. These coding categories are strictly relevant to the researcher’s hypothesis. Quantitative analysis also takes a deductive approach.

Siegfried Kracauer provides a critique of quantitative analysis, asserting that it oversimplifies complex communications in order to be more reliable. On the other hand, qualitative analysis deals with the intricacies of latent interpretations, whereas quantitative has a focus on manifest meanings. He also acknowledges an “overlap” of qualitative and quantitative content analysis. Patterns are looked at more closely in qualitative analysis, and based on the latent meanings that the researcher may find, the course of the research could be changed. It is inductive and begins with open research questions, as opposed to a hypothesis.

Three different definition of content analysis are provided below.

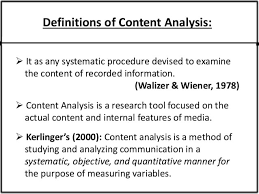
  • Definition 1: “Any technique for making inferences by systematically and objectively identifying special characteristics of messages.” (from Holsti, 1968)
  • Definition 2: “An interpretive and naturalistic approach. It is both observational and narrative in nature and relies less on the experimental elements normally associated with scientific research (reliability, validity and generalizability) (from Ethnography, Observational Research, and Narrative Inquiry, 1994-2012).
  • Definition 3: “A research technique for the objective, systematic and quantitative description of the manifest content of communication.” (from Berelson, 1952)

Uses of Content Analysis

  • Identify the intentions, focus or communication trends of an individual, group or institution
  • Describe attitudinal and behavioral responses to communications
  • Determine psychological or emotional state of persons or groups
  • Reveal international differences in communication content
  • Reveal patterns in communication content
  • Pre-test and improve an intervention or survey prior to launch
  • Analyze focus group interviews and open-ended questions to complement quantitative data

Types of Content Analysis

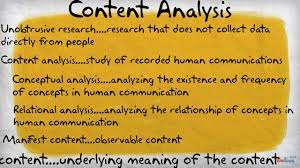
There are two general types of content analysis: conceptual analysis and relational analysis. Conceptual analysis determines the existence and frequency of concepts in a text. Relational analysis develops the conceptual analysis further by examining the relationships among concepts in a text. Each type of analysis may lead to different results, conclusions, interpretations and meanings.

Conceptual Analysis

Typically people think of conceptual analysis when they think of content analysis. In conceptual analysis, a concept is chosen for examination and the analysis involves quantifying and counting its presence. The main goal is to examine the occurrence of selected terms in the data. Terms may be explicit or implicit. Explicit terms are easy to identify. Coding of implicit terms is more complicated: you need to decide the level of implication and base judgments on subjectivity (issue for reliability and validity). Therefore, coding of implicit terms involves using a dictionary or contextual translation rules or both.

To begin a conceptual content analysis, first identify the research question and choose a sample or samples for analysis. Next, the text must be coded into manageable content categories. This is basically a process of selective reduction. By reducing the text to categories, the researcher can focus on and code for specific words or patterns that inform the research question.

General steps for conducting a conceptual content analysis:

1. Decide the level of analysis: word, word sense, phrase, sentence, themes

2. Decide how many concepts to code for: develop pre-defined or interactive set of categories or concepts. Decide either: A. to allow flexibility to add categories through the coding process, or B. to stick with the pre-defined set of categories.

  • Option A allows for the introduction and analysis of new and important material that could have significant implications to one’s research question.
  • Option B allows the researcher to stay focused and examine the data for specific concepts.

3. Decide whether to code for existence or frequency of a concept. The decision changes the coding process.

  • When coding for the existence of a concept, the researcher would count a concept only once if it appeared at least once in the data and no matter how many times it appeared.
  • When coding for the frequency of a concept, the researcher would count the number of times a concept appears in a text.

4. Decide on how you will distinguish among concepts:

  • Should text be coded exactly as they appear or coded as the same when they appear in different forms? For example, “dangerous” vs. “dangerousness”. The point here is to create coding rules so that these word segments are transparently categorized in a logical fashion. The rules could make all of these word segments fall into the same category, or perhaps the rules can be formulated so that the researcher can distinguish these word segments into separate codes.
  • What level of implication is to be allowed? Words that imply the concept or words that explicitly state the concept? For example, “dangerous” vs. “the person is scary” vs. “that person could cause harm to me”. These word segments may not merit separate categories, due the implicit meaning of “dangerous”.

5. Develop rules for coding your texts. After decisions of steps 1-4 are complete, a researcher can begin developing rules for translation of text into codes. This will keep the coding process organized and consistent. The researcher can code for exactly what he/she wants to code. Validity of the coding process is ensured when the researcher is consistent and coherent in their codes, meaning that they follow their translation rules. In content analysis, obeying by the translation rules is equivalent to validity.

6. Decide what to do with irrelevant information: should this be ignored (e.g. common English words like “the” and “and”), or used to reexamine the coding scheme in the case that it would add to the outcome of coding?

7. Code the text: This can be done by hand or by using software. By using software, researchers can input categories and have coding done automatically, quickly and efficiently, by the software program. When coding is done by hand, a researcher can recognize error far more easily (e.g. typos, misspelling). If using computer coding, text could be cleaned of errors to include all available data. This decision of hand vs. computer coding is most relevant for implicit information where category preparation is essential for accurate coding.

8. Analyze your results: Draw conclusions and generalizations where possible. Determine what to do with irrelevant, unwanted or unused text: reexamine, ignore, or reassess the coding scheme. Interpret results carefully as conceptual content analysis can only quantify the information. Typically, general trends and patterns can be identified.

Relational Analysis

Relational analysis begins like conceptual analysis, where a concept is chosen for examination. However, the analysis involves exploring the relationships between concepts. Individual concepts are viewed as having no inherent meaning and rather the meaning is a product of the relationships among concepts.

To begin a relational content analysis, first identify a research question and choose a sample or samples for analysis. The research question must be focused so the concept types are not open to interpretation and can be summarized. Next, select text for analysis. Select text for analysis carefully by balancing having enough information for a thorough analysis so results are not limited with having information that is too extensive so that the coding process becomes too arduous and heavy to supply meaningful and worthwhile results.

There are three subcategories of relational analysis to choose from prior to going on to the general steps.

  1. Affect extraction: an emotional evaluation of concepts explicit in a text. A challenge to this method is that emotions can vary across time, populations, and space. However, it could be effective at capturing the emotional and psychological state of the speaker or writer of the text.
  2. Proximity analysis: an evaluation of the co-occurrence of explicit concepts in the text. Text is defined as a string of words called a “window” that is scanned for the co-occurrence of concepts. The result is the creation of a “concept matrix”, or a group of interrelated co-occurring concepts that would suggest an overall meaning.
  3. Cognitive mapping: a visualization technique for either affect extraction or proximity analysis. Cognitive mapping attempts to create a model of the overall meaning of the text such as a graphic map that represents the relationships between concepts.

General steps for conducting a relational content analysis:

1. Determine the type of analysis: Once the sample has been selected, the researcher needs to determine what types of relationships to examine and the level of analysis: word, word sense, phrase, sentence, themes.
2. Reduce the text to categories and code for words or patterns. A researcher can code for existence of meanings or words.
3. Explore the relationship between concepts: once the words are coded, the text can be analyzed for the following:

  • Strength of relationship: degree to which two or more concepts are related.
  • Sign of relationship: are concepts positively or negatively related to each other?
  • Direction of relationship: the types of relationship that categories exhibit. For example, “X implies Y” or “X occurs before Y” or “if X then Y” or if X is the primary motivator of Y.

4. Code the relationships: a difference between conceptual and relational analysis is that the statements or relationships between concepts are coded.
5. Perform statistical analyses: explore differences or look for relationships among the identified variables during coding.
6. Map out representations: such as decision mapping and mental models.

Reliability and Validity

Reliability: Because of the human nature of researchers, coding errors can never be eliminated but only minimized. Generally, 80% is an acceptable margin for reliability. Three criteria comprise the reliability of a content analysis:

  1. Stability: the tendency for coders to consistently re-code the same data in the same way over a period of time.
  2. Reproducibility: tendency for a group of coders to classify categories membership in the same way.
  3. Accuracy: extent to which the classification of text corresponds to a standard or norm statistically.

Validity: Three criteria comprise the validity of a content analysis:

  1. Closeness of categories: this can be achieved by utilizing multiple classifiers to arrive at an agreed upon definition of each specific category. Using multiple classifiers, a concept category that may be an explicit variable can be broadened to include synonyms or implicit variables.
  2. Conclusions: What level of implication is allowable? Do conclusions correctly follow the data? Are results explainable by other phenomena? This becomes especially problematic when using computer software for analysis and distinguishing between synonyms. For example, the word “mine,” variously denotes a personal pronoun, an explosive device, and a deep hole in the ground from which ore is extracted. Software can obtain an accurate count of that word’s occurrence and frequency, but not be able to produce an accurate accounting of the meaning inherent in each particular usage. This problem could throw off one’s results and make any conclusion invalid.
  3. Generalizability of the results to a theory: dependent on the clear definitions of concept categories, how they are determined and how reliable they are at measuring the idea one is seeking to measure. Generalizability parallels reliability as much of it depends on the three criteria for reliability.

Advantages of Content Analysis

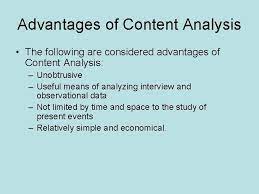
  • Directly examines communication using text
  • Allows for both qualitative and quantitative analysis
  • Provides valuable historical and cultural insights over time
  • Allows a closeness to data
  • Coded form of the text can be statistically analyzed
  • Unobtrusive means of analyzing interactions
  • Provides insight into complex models of human thought and language use
  • When done well, is considered a relatively “exact” research method
  • Content analysis is a readily-understood and an inexpensive research method
  • A more powerful tool when combined with other research methods such as interviews, observation, and use of archival records. It is very useful for analyzing historical material, especially for documenting trends over time.

Disadvantages of Content Analysis

  • Can be extremely time consuming
  • Is subject to increased error, particularly when relational analysis is used to attain a higher level of interpretation
  • Is often devoid of theoretical base, or attempts too liberally to draw meaningful inferences about the relationships and impacts implied in a study
  • Is inherently reductive, particularly when dealing with complex texts
  • Tends too often to simply consist of word counts
  • Often disregards the context that produced the text, as well as the state of things after the text is produced
  • Can be difficult to automate or computerize

Introduction to Statistical Data Analysis

Statistics is basically a science that involves data collection, data interpretation and finally, data validation. Statistical data analysis is a procedure of performing various statistical operations. It is a kind of quantitative research, which seeks to quantify the data, and typically, applies some form of statistical analysis. Quantitative data basically involves descriptive data, such as survey data and observational data.

Statistical data analysis generally involves some form of statistical tools, which a layman cannot perform without having any statistical knowledge. There are various software packages to perform statistical data analysis. This software includes Statistical Package for the Social Sciences (SPSS), Stata soft, etc.

[blog_posts style=”push” col_spacing=”small” columns=”2″ columns__md=”1″ depth_hover=”2″ slider_nav_style=”simple” slider_bullets=”true” auto_slide=”8000″ ids=”8583,8579″ show_date=”false” excerpt_length=”0″ comments=”false” image_height=”56.25%” image_size=”original” image_hover=”zoom”]

[blog_posts style=”push” col_spacing=”small” columns=”3″ columns__md=”1″ depth_hover=”2″ slider_nav_style=”simple” slider_bullets=”true” auto_slide=”8000″ ids=”38973,8588,9046″ show_date=”false” excerpt_length=”0″ comments=”false” image_height=”56.25%” image_size=”original” image_hover=”zoom”]

Data in statistical data analysis consists of variable(s). Sometimes the data is univariate or multivariate. Depending upon the number of variables, the researcher performs different statistical techniques.

[title text=”Main contents” link_text=”See more from basic to advanced” link=”/category/methodology/quantitative-research/quantitative-research-methods/statistics-and-econometrics/”]

[blog_posts style=”normal” col_spacing=”xsmall” columns=”3″ columns__md=”1″ depth_hover=”2″ auto_slide=”5000″ cat=”241″ posts=”3″ offset=”117″ show_date=”false” excerpt_length=”25″ comments=”false” image_height=”60%” image_size=”original” image_hover=”zoom” text_align=”left”]

[blog_posts style=”normal” col_spacing=”xsmall” columns=”3″ columns__md=”1″ depth_hover=”2″ auto_slide=”6000″ cat=”241″ posts=”6″ offset=”111″ show_date=”false” excerpt_length=”25″ comments=”false” image_height=”60%” image_size=”original” image_hover=”zoom” text_align=”left”]

[blog_posts style=”normal” col_spacing=”xsmall” columns=”3″ columns__md=”1″ depth_hover=”2″ auto_slide=”7000″ cat=”241″ posts=”6″ offset=”105″ show_date=”false” excerpt_length=”25″ comments=”false” image_height=”60%” image_size=”original” image_hover=”zoom” text_align=”left”]

[blog_posts style=”normal” col_spacing=”xsmall” columns=”3″ columns__md=”1″ depth_hover=”2″ auto_slide=”8000″ cat=”241″ posts=”6″ offset=”99″ show_date=”false” excerpt_length=”25″ comments=”false” image_height=”60%” image_size=”original” image_hover=”zoom” text_align=”left”]

[blog_posts style=”normal” col_spacing=”xsmall” columns=”3″ columns__md=”1″ depth_hover=”2″ auto_slide=”5000″ cat=”241″ posts=”9″ offset=”90″ show_date=”false” excerpt_length=”25″ comments=”false” image_height=”60%” image_size=”original” image_hover=”zoom” text_align=”left”]

[blog_posts style=”normal” col_spacing=”xsmall” columns=”3″ columns__md=”1″ depth_hover=”2″ auto_slide=”6000″ cat=”241″ posts=”9″ offset=”81″ show_date=”false” excerpt_length=”25″ comments=”false” image_height=”60%” image_size=”original” image_hover=”zoom” text_align=”left”]

[blog_posts style=”normal” col_spacing=”xsmall” columns=”3″ columns__md=”1″ depth_hover=”2″ auto_slide=”7000″ cat=”241″ posts=”9″ offset=”72″ show_date=”false” excerpt_length=”25″ comments=”false” image_height=”60%” image_size=”original” image_hover=”zoom” text_align=”left”]

[blog_posts style=”normal” col_spacing=”xsmall” columns=”3″ columns__md=”1″ depth_hover=”2″ auto_slide=”8000″ cat=”241″ posts=”9″ offset=”63″ show_date=”false” excerpt_length=”25″ comments=”false” image_height=”60%” image_size=”original” image_hover=”zoom” text_align=”left”]

[row style=”small” class=”form-lien-he”]

[col span=”2″ span__sm=”12″]

[/col]
[col span=”4″ span__sm=”12″]

[button text=”Home” color=”secondary” style=”gloss” radius=”5″ depth=”2″ depth_hover=”3″ expand=”true” icon=”icon-star” icon_pos=”left” link=”https://phantran.net/”]

[/col]
[col span=”4″ span__sm=”12″]

[button text=”See basic to advanced” style=”gloss” radius=”5″ depth=”2″ depth_hover=”3″ expand=”true” icon=”icon-checkmark” icon_pos=”left” link=”/category/methodology/quantitative-research/quantitative-research-methods/statistics-and-econometrics/”]

[/col]
[col span=”2″ span__sm=”12″]

[/col]

[/row]

If the data in statistical data analysis is multiple in numbers, then several multivariates can be performed. These are factor statistical data analysis, discriminant statistical data analysis, etc. Similarly, if the data is singular in number, then the univariate statistical data analysis is performed. This includes t test for significance, z test, f test, ANOVA one way, etc.

The data in statistical data analysis is basically of 2 types, namely, continuous data and discreet data. The continuous data is the one that cannot be counted. For example, intensity of a light can be measured but cannot be counted. The discreet data is the one that can be counted. For example, the number of bulbs can be counted.

The continuous data in statistical data analysis is distributed under continuous distribution function, which can also be called the probability density function, or simply pdf.

The discreet data in statistical data analysis is distributed under discreet distribution function, which can also be called the probability mass function or simple pmf.

We use the word ‘density’ in continuous data of statistical data analysis because density cannot be counted, but can be measured. We use the word ‘mass’ in discreet data of statistical data analysis because mass cannot be counted.

There are various pdf’s and pmf’s in statistical data analysis. For example, Poisson distribution is the commonly known pmf, and normal distribution is the commonly known pdf.

These distributions in statistical data analysis help us to understand which data falls under which distribution. If the data is about the intensity of a bulb, then the data would be falling in Poisson distribution.

There is a major task in statistical data analysis, which comprises of statistical inference. The statistical inference is mainly comprised of two parts: estimation and tests of hypothesis.

Estimation in statistical data analysis mainly involves parametric data—the data that consists of parameters. On the other hand, tests of hypothesis in statistical data analysis mainly involve non parametric data— the data that consists of no parameters.

Meta-analysis in management research

What is a meta-analysis? and Why perform a meta-analysis?

“Meta-analysis is the statistical combination of results from two or more separate studies” (Deeks et al, 2019, chapter 10). When the treatment effect (or effect size) is consistent from one study to the next, meta-analysis can be used to identify this common effect. When the effect varies from one study to the next, meta-analysis may be used to identify the reason for the variation.

Decisions about the utility of an intervention or the validity of a hypothesis cannot be based on the results of a single study, because results typically vary from one study to the next. Rather, a mechanism is needed to synthesize data across studies. Narrative reviews had been used for this purpose, but the narrative review is largely subjective (different experts can come to different conclusions) and becomes impossibly difficult when there are more than a few studies involved. Meta-analysis, by contrast, applies objective formulas (much as one would apply statistics to data within a single study), and can be used with any number of studies.

Pharmaceutical companies use meta-analysis to gain approval for new drugs, with regulatory agencies sometimes requiring a meta-analysis as part of the approval process. Clinicians and applied researchers in medicine, education, psychology, criminal justice, and a host of other fields use meta-analysis to determine which interventions work, and which ones work best. Meta analysis is also widely used in basic research to evaluate the evidence in areas as diverse as sociology, social psychology, sex differences, finance and economics, political science, marketing, ecology and genetics, among others.

[title text=”Main contents” link_text=”See more from basic to advanced” link=”/category/methodology/quantitative-research/quantitative-research-methods/meta-analysis/”]

[blog_posts style=”normal” col_spacing=”xsmall” columns=”3″ columns__md=”1″ depth_hover=”2″ auto_slide=”5000″ cat=”242″ posts=”3″ offset=”53″ show_date=”false” excerpt_length=”25″ comments=”false” image_height=”60%” image_size=”original” image_hover=”zoom” text_align=”left”]

[blog_posts style=”normal” col_spacing=”xsmall” columns=”3″ columns__md=”1″ depth_hover=”2″ auto_slide=”6000″ cat=”242″ posts=”3″ offset=”50″ show_date=”false” excerpt_length=”25″ comments=”false” image_height=”60%” image_size=”original” image_hover=”zoom” text_align=”left”]

[blog_posts style=”normal” col_spacing=”xsmall” columns=”3″ columns__md=”1″ depth_hover=”2″ auto_slide=”7000″ cat=”242″ posts=”6″ offset=”44″ show_date=”false” excerpt_length=”25″ comments=”false” image_height=”60%” image_size=”original” image_hover=”zoom” text_align=”left”]

[blog_posts style=”normal” col_spacing=”xsmall” columns=”3″ columns__md=”1″ depth_hover=”2″ auto_slide=”8000″ cat=”242″ posts=”6″ offset=”38″ show_date=”false” excerpt_length=”25″ comments=”false” image_height=”60%” image_size=”original” image_hover=”zoom” text_align=”left”]

[blog_posts style=”normal” col_spacing=”xsmall” columns=”3″ columns__md=”1″ depth_hover=”2″ auto_slide=”5000″ cat=”242″ posts=”6″ offset=”32″ show_date=”false” excerpt_length=”25″ comments=”false” image_height=”60%” image_size=”original” image_hover=”zoom” text_align=”left”]

[blog_posts style=”normal” col_spacing=”xsmall” columns=”3″ columns__md=”1″ depth_hover=”2″ auto_slide=”6000″ cat=”242″ posts=”6″ offset=”26″ show_date=”false” excerpt_length=”25″ comments=”false” image_height=”60%” image_size=”original” image_hover=”zoom” text_align=”left”]

[blog_posts style=”normal” col_spacing=”xsmall” columns=”3″ columns__md=”1″ depth_hover=”2″ auto_slide=”7000″ cat=”242″ posts=”6″ offset=”20″ show_date=”false” excerpt_length=”25″ comments=”false” image_height=”60%” image_size=”original” image_hover=”zoom” text_align=”left”]

[blog_posts style=”normal” col_spacing=”xsmall” columns=”3″ columns__md=”1″ depth_hover=”2″ auto_slide=”8000″ cat=”242″ posts=”6″ offset=”14″ show_date=”false” excerpt_length=”25″ comments=”false” image_height=”60%” image_size=”original” image_hover=”zoom” text_align=”left”]

[row style=”small” class=”form-lien-he”]

[col span=”2″ span__sm=”12″]

[/col]
[col span=”4″ span__sm=”12″]

[button text=”Home” color=”secondary” style=”gloss” radius=”5″ depth=”2″ depth_hover=”3″ expand=”true” icon=”icon-star” icon_pos=”left” link=”https://phantran.net/”]

[/col]
[col span=”4″ span__sm=”12″]

[button text=”See basic to advanced” style=”gloss” radius=”5″ depth=”2″ depth_hover=”3″ expand=”true” icon=”icon-checkmark” icon_pos=”left” link=”/category/methodology/quantitative-research/quantitative-research-methods/meta-analysis/”]

[/col]
[col span=”2″ span__sm=”12″]

[/col]

[/row]

Where does meta-analysis fit in the research process?

Publications

Many journals encourage researchers to submit systematic reviews and meta-analyses that summarize the body of evidence on a specific question, and this approach is replacing the traditional narrative review. Meta-analyses also play supporting roles in other papers.  For example, a paper that reports results for a new primary study might include a meta-analysis in the introduction to synthesize prior data and help to place the new study in context.

Planning new studies

Meta-analyses can play a key role in planning new studies. The meta-analysis can help identify which questions have already been answered and which remain to be answered, which outcome measures or populations are most likely to yield significant results, and which variants of the planned intervention are likely to be most powerful.

Grant applications

Meta-analyses are used in grant applications to justify the need for a new study.  The meta-analysis serves to put the available data in context and to show the potential utility of the planned study. The graphical elements of the meta-analysis, such as the forest plot, provide a mechanism for presenting the data clearly, and for capturing the attention of the reviewers. Some funding agencies now require a meta-analysis of existing research as part of the grant application to fund new research.

A Definition of Content Analysis

In content analysis, evaluators classify the key ideas in a written communication, such as a report, article, or film. Evaluators can do content analysis of video, film, and other forms of recorded information, but in this paper, we focus on analyzing words. Here is a formal definition of content analysis: it is a systematic research method for analyzing textual information in a standardized way that allows evaluators to make inferences about that information. (Weber, 1990, pp.9-12, and Krippendorff, 1980, pp. 21-27) Another expression of this is as follows: “A central idea in content analysis is that the many words of the text are classified into much fewer content categories.” (Weber, 1990, p. 12)

The classification process, called “coding,” consists of marking text passages with short alphanumeric codes. This creates “categorical variables” that represent the original, verbal information and that can then be analyzed by standard statistical methods. The text passages can come from structured interviews, focus group discussions, case studies, open-ended questions on survey instruments, workpapers, agency documents, and previous evaluations. 1 Content analysis is particularly useful in GAO work because of the large quantity of written material that evaluators typically collect during a project, especially when it
comes from diverse and unstructured sources.

To classify a document’s key ideas, the evaluator identifies its themes, issues, topics, and so on. Theresult  might be a simple list of the topics in a series of meeting notes. Content analysis can go further if theevaluator counts  the frequency of statements, detects subtle differences in their intensity, or examines issues over time, in different situations, or from different groups.

Thus, content analysis can not only help summarize the formal content of written material; it can also describe the attitudes or perceptions of the author of that material. For example, if an evaluator wanted to assess the effects of a program on the lives of older people from their perspective, he or she could analyze open-ended interview responses to determine their outlook on life, loneliness, or security. Similarly, an evaluator could assess the effect of Voice of America broadcasts by analyzing the content of Soviet newspaper articles and radio broadcasts. (Inkeles, 1952)

Source: GAO (2013), Content Analysis: A Methodology for Structuring and Analyzing Written Material: PEMD-10.3.1, BiblioGov.

The Uses of Content Analysis

Here are several ways in which GAO evaluators have successfully used content analysis techniques.

  1. In Stars and Stripes: Inherent Conflicts Lead to Allegations of Military Censorship (GAO, 1988), GAO evaluators used content analysis to help assess issues of censorship, news management, and other influences on various editions of the military newspaper. Details of technique and substance from this report are used as examples throughout this transfer paper.
  2. In Student Loans: Direct Loans Could Save Billions in First 5 Years With Proper Implementation (GAO, 1992c), GAO evaluators examined transcripts of focus groups discussing the difficulty of implementing a student loan program. The participants’ views on whether the Department of Education could administer a direct loan program were mixed, but the evaluators were able, through content analysis, to highlight the dominant views and the reasons for them.
  3. Federal Employment: How Federal Employees View the Government As a Place to Work (GAO, 1992a) reported that while the majority of the survey respondents looked favorably on working for the government, many did not. The evaluators used content analysis to assess the respondent’s insightful, written comments to open-ended questions. An appendix in the report is devoted to the analysis of these comments.
  4. Another excellent example of the use of content analysis appears in Women in the Military: Deployment in the Persian Gulf War (GAO, 1993c). For this study, the evaluators gave a primarily positive assessment of women’s performance, using content analysis to determine that while men and women endured similarly harsh encampment facilities and conditions, both men and women considered health and hygiene problems inconsequential and their cohesion in mixed-gender units effective.
  5. Among other fine examples of the use of content analyis is Veterans’ Health Care: Veterans’. Perceptions of VA Services and VA’s Role in Health Care Reform (GAO, 1994a). The report’s scope and methodology section details the analysis and summary of veterans’ views that changing the VA system could, among other things, diminish or eliminate their benefits as well as harm them both emotionally and in terms of their specialized health care needs.

Other uses of content analysis in GAO reports include an analysis of transcripts of focus groups on people’s ability to participate in food assistance programs (GAO, 1990), an analysis of descriptive text on the maintenance of aging aircraft (GAO, 1993a), and an analysis of open-ended discussions with Amerasian immigrants on their experiences in Vietnam, the Philippines, and the United States (GAO, 1994b).

Source: GAO (2013), Content Analysis: A Methodology for Structuring and Analyzing Written Material: PEMD-10.3.1, BiblioGov.

Computerized Content Analysis

The increasing availability of written information on computer files, and the increasing number of computer programs to analyze text files, makes content analysis easier to do than ever before. Moreover, computerized programs can easily code textual data and combine them with quantitative data. The evaluator can then analyze both kinds of data with various statistical methods. However, content analysis can proceed even when written information is not available in computer files.

Source: GAO (2013), Content Analysis: A Methodology for Structuring and Analyzing Written Material: PEMD-10.3.1, BiblioGov.

Some Advantages of Content Analysis

1. It Can Be Unobtrusive

One problem with surveys and some experimental methods is that evaluators and their informants can interact during data collection in ways other than how they would “naturally” react. For example, a content analysis of the hearing transcripts might be more useful than interviews with federal officials about what took place during public hearings on proposed environmental regulations. The officials might leave out important points, unconsciously or purposely, in order to protect themselves, but the transcripts provide the complete record. Thus, bias can be reduced dining data collection. Similarly, the evaluator can eliminate from analysis survey questions that might be inappropriate because they invaded a respondent’s privacy.

2. It Can Deal With Large Volumes of Material

Content analysis has explicit procedures and quality control checks that make it possible for only a few or a great number of evaluators to analyze large volumes of textual data. Furthermore, the explicit procedures and quality control checks allow two or more groups of analysts to work on the same kind of data in different geographic locations, and computer software may be used to perform many of the required steps. (See appendix II.)

3. It Is Systematic

Content analysis can help evaluators learn more about the issues and programs they examine because it is systematic. It has structured forms that allow evaluators to extract relevant information more consistently than if they were reading the same documents only casually.

4. It Can Corroborate Other Evaluation Methods

When the findings from content analysis are not the main evidence in an evaluation, they can still be used to help corroborate other findings, such as responses from closed-ended surveys or from economic measures. For example, Webb and colleagues have described how investigators can use “multiple operations” to increase confidence in their findings, although we do not discuss them in this paper. (Webb et al., 1981)

Source: GAO (2013), Content Analysis: A Methodology for Structuring and Analyzing Written Material: PEMD-10.3.1, BiblioGov.

Some Disadvantages of Content Analysis

Because content analysis is systematic, sufficient human resources must be committed to it and rigorously applied to it. This may mean, for some evaluation applications, that the benefits may not outweigh the cost of the resources. Moreover, while content analysis has safeguards against distortion of the evidence, evaluators must use judgment in coding the data. If the potential users of the results will be uneasy about the judgment-making process, content analysis may not be advisable. A different approach that does not convert text to categorical variables might be preferable. (See appendix I.)

Source: GAO (2013), Content Analysis: A Methodology for Structuring and Analyzing Written Material: PEMD-10.3.1, BiblioGov.

How to Apply Content Analysis

GAO evaluators can use content analysis to articulate a program’s objectives, describe its activities, and determine its results.

1. Program Objectives

Many evaluations characterize a program’s objectives. For example, evaluators might compare a program’s legislative objectives with those of the executive branch. To do this, they might gather written or tape-recorded information from the program’s legislative history and from interviews with agency officials. In content analysis, they would then be able to compare the two kinds of documentary sources to determine whether the agency’s goals conform to its legislative intent.

2. Program Activities

To describe a program’s activities, an evaluator could perform case studies, attend agency meetings, or interview program stakeholders (for example, managers, service deliverers, or beneficiaries) and then use content analysis to examine the results. For example, GAO evaluators might ask. program stakeholders open-ended questions about a program’s activities and then describe them by simply tabulating the categories of activities the respondents have reported.

The extent to which program activities were accurately targeted could also be investigated. Evaluators could interview program beneficiaries and analyze their responses to assess their eligibility for the program’s services. The responses could then be compared with established eligibility criteria, and the evaluators could estimate the proportion of program recipients who were truly eligible.

3. Program Results

When evaluators want to estimate the results of a program, they might take sample surveys, construct case studies, or examine earlier evaluation reports. When such data are quantitative, a variety of statistical procedures can be applied. (See GAO, 1992e, and Mohr, 1988.) However, to the extent that such data are textual, the evaluator can estimate program results with the help of content analysis.

Evaluators may analyze content when they are, for example, uncertain about program effectiveness criteria or when they find many diverse criteria within the program, are engaged in exploratory work, want to ensure that structured questions did not miss
something, or want to clarify the meaning of close-ended questions.

Source: GAO (2013), Content Analysis: A Methodology for Structuring and Analyzing Written Material: PEMD-10.3.1, BiblioGov.

Assignment Objectives of Content Analysis

GAO often expresses an assignment’s objectives in the form of three broad categories of evaluation question: descriptive, normative, or impact questions. (GAO, 1991c) In theory, content analysis can address all three categories. In practice, descriptive and normative questions are especially amenable to content analysis; program impact questions are less commonly answered through content analysis.

Answering a descriptive question provides information about conditions or events. For example, in a report on alleged censorship of news stories in Stars and Stripes, GAO used content analysis to describe the sources and nature of articles printed in the paper’s European and Pacific editions. An advisory panel of professional journalists made judgments about allegations of managing and censoring the news; GAO supplied the results of its content analysis to the panel for its deliberations.

The answer to a normative question compares an outcome to a norm, or standard. In the Stars and Stripes report, evaluators made normative comparisons between news coverage and content in the military newspaper and related stories from the Associated Press and United Press International that had been the source for the Stars and Stripes stories. The question “To what extent does the content of news stories in Stars and Stripes indicate news management or censorship?” is normative because it implies a criterion.

Impact questions were beyond the scope of GAO’s Stars and Stripes study. For example, the evaluation did not attempt to estimate the impact of a 1984 change in Department of Defense (DOD) editorial policy for the newspaper by comparing news articles before and after 1984. In another study, however, GAO evaluators did use content analysis to examine the perception of impact rather than the impact itself when they determined the views of military veterans about health care in VA hospitals. (GAO, 1994b)

Source: GAO (2013), Content Analysis: A Methodology for Structuring and Analyzing Written Material: PEMD-10.3.1, BiblioGov.

Data Available or to Be Collected for Content Analysis

Whether or not content analysis is appropriate depends on the nature of the information to be evaluated. The information can be anything written: an original document; a transcript of a speech, conversation, discussion, or oral answer to a question; or a verbal description of visual information, such as a film, video, or photograph. Documents may be government administrative records, newspaper articles or editorials, answers to questions in an interview or questionnaire, transcripts of focus group discussions, advertising copy, judicial decisions, program evaluations, descriptions of program activities, field notes, or summaries of workpapers. Some documents may already exist at the beginning of the assignment; others may have to be created through data collection during the assignment.

Source: GAO (2013), Content Analysis: A Methodology for Structuring and Analyzing Written Material: PEMD-10.3.1, BiblioGov.

Kinds of Data Required for Content Analysis

In the early stages of an assignment, evaluators choose variables of interest. For the descriptive Stars and Stripes assignment, for example, important variables included the frequency of stories on selected issues, such as the Iran-contra affair and the presidential campaign; the percentage of stories from other sources, such as staff reporters, AP, UPI, and other wire services; and the percentage of stories that conveyed a negative DOD image. (GAO, 1988) Obviously, if documents are to be useful, they must promise to yield information on the variables of interest.

For a normative evaluation, the variables are often similar to those for a descriptive evaluation, because the only difference is the addition of a criterion in the normative evaluation. In a program impact evaluation, the kinds of data that are required include outcome variables and contextual variables that may be necessary to rule out rival explanations for the outcomes. (GAO, 1991c)

Source: GAO (2013), Content Analysis: A Methodology for Structuring and Analyzing Written Material: PEMD-10.3.1, BiblioGov.

Kinds of Analysis Required in Content Analysis

Considering data requirements goes hand in hand with analysis requirements. In many evaluations, the most important, or only, form of analysis may be a simple aggregation of quantitative data or a comparison of categorical variables. When the subject matter is textual and the evaluation questions lend themselves to numerical descriptions or comparisons, content analysis is usually a good choice. For example, in the Stars and Stripes study, a key question pertained to whether the European and Pacific editions differed in the types of stories they covered. Therefore, the evaluators classified textual data into story topic categories and displayed most of the results in simple tables that compared frequency counts for the two editions.

Had the Stars and Stripes report required a comparison of subtleties in the language of the news stories, then content analysis would probably not have been the best methodology to use. Kather than transform the text into categories, a better approach might have been to retrieve and display comparable passages side by side. Evaluators could then systematically form conclusions about the apparent differences. (See appendix I.)

Source: GAO (2013), Content Analysis: A Methodology for Structuring and Analyzing Written Material: PEMD-10.3.1, BiblioGov.

Resources Needed in Content Analysis

In content analysis, evaluators must consider three principal types of resources: an analyst with the technical knowledge and experience to plan and direct the content analysis, personnel to do the coding, and computer capability to carry out the analysis. At least one member of the project team should know about content analysis and have experience with it. This person then takes responsibility for planning the technical aspects of the work, training the team members who will make the classifications, supervising the production of a database, and either performing or directing the statistical analysis.

Team members knowledgeable about the subject matter must carefully read the text and code its passages. Except for the very smallest textual databases, the coding process is fairly labor-intensive. For example, in a recent AID evaluation, coding 280 interviews required approximately 4 person-weeks, even with the aid of computer software. This does not include the time devoted to developing the coding system (several days), transcribing the interviews and getting them into a form suitable for computer analysis (approximately 3 person-weeks of clerical staff time), and training the coders (2 days).

The resources of personnel to do coding and computer capability to do the analysis are frequently interrelated because the coding task can be carried out with software. For most GAO content analyses, the amount of data dictates whether analysis is to be done by computer. This means that the textual data must be suitable for computer processing and specialized programs must be available. (Appendix II reviews some of these programs.)

Source: GAO (2013), Content Analysis: A Methodology for Structuring and Analyzing Written Material: PEMD-10.3.1, BiblioGov.

Defining the Variables in Content Analysis

The assignment’s evaluation questions lead directly to the relevant variables. In the Stars and Stripes example, we asked “To what extent does the content of news stories in Stars and Stripes indicate management or censorship of the news management?” In practice, however, defining a variable may be separated into two parts: conceptualizing the variable and specifying its categories.

1. Conceptualizing and Categorizing

“Conceptualizing a variable” means identifying subjects, things, or events that vary and that will help us answer the question. In the Stars and Stripes example, the two variables “news story topic” and “image of the .military” were defined. News story topic
was variable across the stories that appeared in Stars and Stripes, and the paper’s distorted coverage or-topics might indicate news management or censorship. Image of the military could also conceivably vary across the paper’s stories, and imbalance in the image of the U.S. military might be another indicator of news management or censorship.

“Specifying the categories” distinguishes one subject, thing, or event from others by putting them each and severally into a limited number of categories. Thus, to completely define a variable for content analysis, we need to specify its categories. The variable’s category may be either nominal or ordinal and it must be exclusive and exhaustive. Nominal variables have nointrin sic order. For example, gender can be treated as a nominal variable with two categories-male and female-but there is nothing about either category that warrants ranking one ahead of the other. Ordinal variables do have an intrinsic order. For example, attitude is often divided into categories such as greatly dislike, moderately dislike, indifferent to, moderately like, and greatly like. These categories can be ranked from top to bottom or bottom to top.

Categories must be mutually exclusive and  exhaustive. If they overlap, then information may be erroneously classified. Likewise, if the categories do not cover all possible classes of information, then a variable may be misclassified or not recorded at all.
News story topic in the Stars and Stripes example was a nominal variable that had five categories: acquired immunodeficiency syndrome, Iran-contra, strategic issues (such as Intermediate Nuclear Forces and the Strategic Defense Initiative), the 1988 presidential campaign, and other. Each news story could thus be conceptually labeled as fitting into one of these categories. The first four categories corresponded to politically sensitive topics, so they seemed relevant to the evaluation question. The fifth category, “other,” ensured that all stories would be labeled.

Military image was also a nominal variable but it had four categories: negative, neutral, positive, and mixed.

Each news story about the U.S. military was placed into one of the categories. If the variable had had only the three categories negative, neutral, and positive, it would have been not nominal but ordinal. The category “mixed” was included because without it
some stories would not have been classified. This fourth category helped ensure that the categories were mutually exclusive and exhaustive.

2. Determining the Number of Categories

What dictates the number of categories for a variable? Some variables seem to have an intrinsic set of categories. For example, a week can have seven categories (the seven days) or two (weekdays and weekend). For news story topic, the list of possible
categories is virtually endless, so the evaluator must use judgment and be guided by the evaluation question.

In the Stars and Stripes assignment, the evaluators needed evidence to show the extent, if any, of news management or censorship. Studying all possible categories of news story was not feasible, so they chose only those for which they could determine some editorial manipulation.

The practical limit to the number of categories that I can be handled is important. Both the coding process and the analytical tools available may suggest upper limits. And, certainly, the interpretation of results can become very complicated when categories are
numerous. Generally speaking, the categories assigned to each variable should not exceed seven inthe f inal steps of the analysis but may include more in the coding process because later, after the results of coding are known, evaluators can combine some categories. They may not, however, expand them.

Some ordered variables have a natural middle or neutral point. For those that do, selecting an uneven number of categories allows coders to determine a middle ground. For’ example, for observations about attitude, the five categories greatly dislike,  moderately dislike, indifferent to, moderately like, and greatly like are better than the four categories greatly dislike, moderately dislike, moderately like, and greatly like. This is because the latter scaleunrealis tically forces all attitudes into either negative
or positive categories.

Source: GAO (2013), Content Analysis: A Methodology for Structuring and Analyzing Written Material: PEMD-10.3.1, BiblioGov.

Selecting Material for Analysis in Content Analysis

To select textual material to include in the content analysis, evaluators may find it easiest to think first about a population of documents. For some assignments, this population may already exist, as in the Stars and Stripes evaluation. For other assignments, evaluators have to collect data into a database. This happened when GAO evaluators used focus groups to obtain responses to food assistance programs on Indian reservations. (GAO, 1990)

1. Defining a Document

A document should be physically separable, minimally sized, and self-contained textual information. A letter is a document. Each daily edition of Stars and Stripes is a document. A file folder is not a document because it contains within it smaller it~ms that are physically separable, some of which are self-contained. A book is somewhat ambiguous as a document. Most books could be considered documents, but an edited book in which each chapter had separate authors might better be thought of as an aggregate of documents. A transcription of an open-ended interview would probably be defined as a document. However, if the scope of the evaluation were limited to responses to just one interview question, then a transcription of just the pertinent answer might be the document. Thus, evaluators have latitude in defining a document. The guiding principle is to let the evaluation’s purpose and needs determine the definition.

2. Choosing a Sampling Method

Sampling is necessary when a document population is too large to be analyzed in its entirety. Two broad options are available, probability sampling and nonprobability sampling. Probability sampling may be the right choice if the evaluation question implies the need to generaliz~ from the sample to the population and if the procedures required for probability sampling are practical UI).der the circumstances. N onprobability sampling, sometimes called judgment or purposeful sampling, may be the right choice if generalization is not necessary or if probability sampling procedures are not practical. Examples of probability sampling and nonprobability sampling are GAO (1992d) and Patton (1990, pp. 169-83),respectively.

In some assignments, multistage sampling is appropriate. For example, in a study of federal personnel actions, one might first select a probability sample of personnel folders-an aggregate of self-contained documents-and then, in the second stage, sample “action” ‘documents within the folders. Sampling a document’s segments may also be useful. For example, in a study of recommendations from GAO reports, we might probabilistically select one recommendation (that is, the recommendation itself plus its supporting material) from each of several reports. Weber (1990) recommends that documents be sampled in their entirety in order to preserve semantic coherence. However, the sampling of segments may be a good strategy when a document contains substantial amounts of material not relevant to the study or when it is desirable to draw information from a large number of lengthy documents.

The Stars and Stripes content analysis used sampling. Since two editions of the paper had been published-dailies in Europe and the Pacific-a reasonable population of documents wolild be all issues of Stars and Stripes published in the decade ending in 1988. (The Congress had made its study request in 1987.) During the decade 1978-88, each edition contained 28 pages, so the document population was much too large to be studied in its entirety.

To reduce the textual material to manageable proportions, the evaluators chose a nonprobabil isticsample of documents. Specifically, they selected all issues of both the Pacific and European editions that ublished in March 1987.2 For content analysis,
they chose only news stories. For comparison purposes, they also identified all AP and UPI stories that dealt with DOD and the U.S. military and with sensitive topics otherwise cited in the allegations of censorship.


Source: GAO (2013), Content Analysis: A Methodology for Structuring and Analyzing Written Material: PEMD-10.3.1, BiblioGov.

Defining the Recording Unit for Content Analysis

Once evaluators have defined the variables and selected the textual material, their next major task is to define the recording units. A recording unit is the portion of text to which evaluators apply a category label. For example, the Stars and Stripes news story was the focus of analysis in that the evaluation objective was to draw conclusions about whether the stories had been subject to news management or censorship. Therefore, the news story became the recording unit; each news story was categorized by topic, and each news story about the U.S. military was categorized by image. In general, six recording units are commonly used: word, word sense, sentence, paragraph, theme, and whole text. (Weber, 1990)

1. Words

When words are the recording unit, evaluators categorize each individual word. This recording unit is well-defined because we know the physical boundaries of a word. When all words have been placed in categories, a content analysis becomes simply a word count. Although word counts would probably find limited application in GAO, knowing the frequency of key words may be useful. Most content analysis software and some other specialized forms of software can automatically count individual words.

2. Word Sense

“Word sense” is a variation on words as units. Some computer programs can automatically distinguish between the multiple meanings of a word and can identify phrases that constitute semantic units the way words constitute semantic units. The word senses can then be counted just as if they were words. Applications in GAO are probably limited.

3. Sentences

Sentences may occasionally be useful recording units, especially in structured material such as written responses to an open-ended questionnaire item. Although the physical boundaries of sentences are well-defined, using them as units implies human coding, because computer programs cannot automatically classify sentences as they do words and word senses.

4. Paragraphs

A paragraph is a structured unit above the sentence, so it can be a recording unit. Sometimes, however, a paragraph embraces too many ideas for consistent assignment of the text segment to a single category. This leads to the problem of unreliable coding (discussed in chapter 4).

5. Theme

Theme is probably better suited than sentences to coding open-ended questionnaires because a theme can include the several sentences that are commonly a response to such questions. Theme is a useful recording unit, if somewhat ambiguous. Holsti describes a theme as “a single assertion about some subject” (1969, p. 116). The boundary of a theme delineates a single idea; we are not restricted to the individual semantic boundaries of sentences and paragraphs. The evaluator who defines theme as a recording unit should include guidance regarding whether, at one extreme, sentence fragments can be coded or, at the other, paragraphs or multiple paragraphs. However, even with such guidance, coders necessarily use their judgment in determining the boundaries of particular theme units and may therefore be unreliable in their coding.

6. Whole Text

Whole text is a recording unit larger than a paragraph but still with clearly defined physical boundaries. For example, in the Stars and Stripes assessment, a whole news story was a unit of analysis. A news story has physical and other attributes that coders can ordinarily use to distinguish it easily from editorials or syndicated columns. In the extreme, an entire document may be a recording unit. Whole-text coding is almost always unreliable.

Source: GAO (2013), Content Analysis: A Methodology for Structuring and Analyzing Written Material: PEMD-10.3.1, BiblioGov.

Developing an Analysis Plan in Content Analysis

Developing a plan for an analysis is the final planning step. It finks the data back to the evaluation question.

Traditionally, most content analyses have focused on the presence of variables or their frequency, intensity, or identity by space or time.

1. The Presence of a Variable

Analysis sometimes focuses on the mere presence of a variable in a document. For example, in examining the roles and performance of women in the military, GAO evaluators conducted a number of focus groups and treated the transcript for each group as a document. One v;:μ-iable was “attitude about women’s job performance,” and it had two categories, positive and negative. In one part of the analysis, the evaluators simply tabulated the number of focus groups in which participants registered either positive or negative views about women’s job performance. That is, a given focus group was described not by the number of positive and negative views that that group expressed but just by whether it expressed any positive or negative views.

2. The Frequency of a Category

Counting the number of times a category is coded is more than simply tabulating the number of documents in which the code appears. In a study of how federal employees view the government as a place to work, GAO evaluators identified 21 variables, each with two categories. For example, one variable was attitude about pay. with two categories: positive and negative. The evaluators gathered answers to an open-ended question at the end of a mail-out questionnaire sent to a random sample of employees; they counted all instances in which each category was coded across all documents. (GAO, 1992b) Singleton
et al. (1988) says that the frequency count is the most common method for measuring content.

3. Intensity

Analysis of intensity assumes ordinal categories. (GAO, 1992e) We often measure the intensity of a person’s opinions or attitudes, but other kinds of intensity variables are possible. For example, in one study, coders rated the strength of association between learning outcomes and 228 different factors in 179 reviews of school learning research. Strength of association had three categories: (1) weak, uncertain, or inconsistent relationship to learning, (2) moderate relationship, and (3) strong relationship. The primary data analysis was the computation of means for groups of variables. (Wang, Haertel, and Walberg, 1990).

4. Space or Time

Analyzing the space or time devoted to a topic in a document is common in content analysis. For example, the newspaper space (measured in column inches) associated with a topic may reflect the importance of a topic. For television or radio, air time is a similar measure. Note that using space or time in content analysis requires more than just coding the topic. For example, in one study, evaluators first used column inches to draw conclusions about newspaper coverage of foreign news and then applied a statistical test to compare differences in coverage between newspapers that had overseas staff with those that did not. (Budd, Thorp, and Donohew, 1967,pp. 12-13)

5. Analysis Options

In developing a data analysis plan, evaluators depend for analysis options on the measurement level of the variables-nominal, ordinal, or interval (or ratio). (GAO, 1992e) When evaluators choose nominal variables, they commonly tabulate category frequencies, but other possibilities exist. (Reynolds, 1984) With ordinal variables come other possibilities. (Hildebrand, Laing, and Rosenthal, 1977) Interval, or ratio, variables-which may be used in conjunction with variables coded from qualitative information-afford many possibilities for data analysis and are well covered in many statistical textbooks. (Moore and McCabe, 1989).

Source: GAO (2013), Content Analysis: A Methodology for Structuring and Analyzing Written Material: PEMD-10.3.1, BiblioGov.