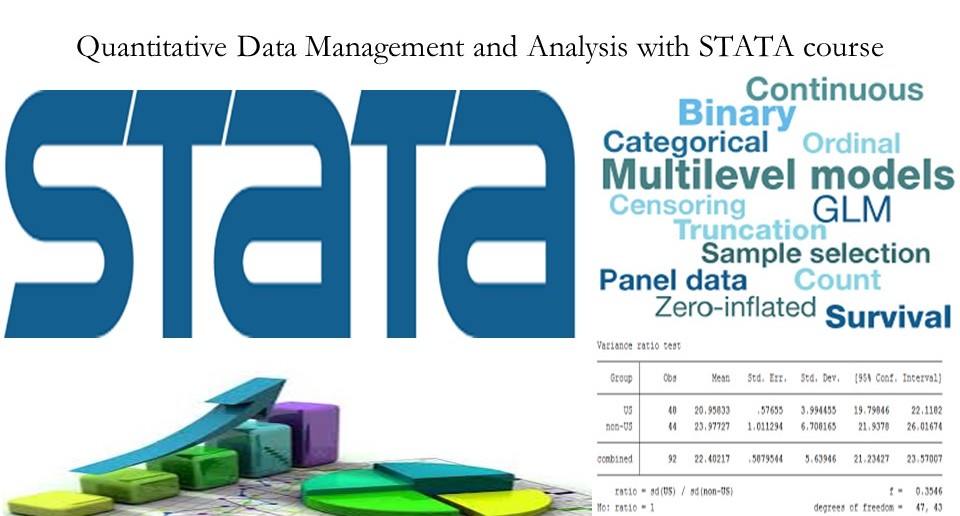
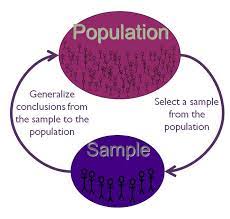
Statistics is basically a science that involves data collection, data interpretation and finally, data validation. Statistical data analysis is a procedure of performing various statistical operations. It is a kind of quantitative research, which seeks to quantify the data, and typically, applies some form of statistical analysis. Quantitative data basically involves descriptive data, such as survey data and observational data.
Statistical data analysis generally involves some form of statistical tools, which a layman cannot perform without having any statistical knowledge. There are various software packages to perform statistical data analysis. This software includes Statistical Package for the Social Sciences (SPSS), Stata soft, etc.


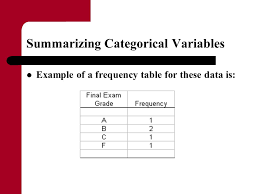
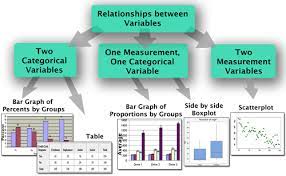
Data in statistical data analysis consists of variable(s). Sometimes the data is univariate or multivariate. Depending upon the number of variables, the researcher performs different statistical techniques.
Main contentsSee more from basic to advanced


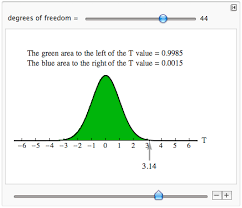
If the data in statistical data analysis is multiple in numbers, then several multivariates can be performed. These are factor statistical data analysis, discriminant statistical data analysis, etc. Similarly, if the data is singular in number, then the univariate statistical data analysis is performed. This includes t test for significance, z test, f test, ANOVA one way, etc.
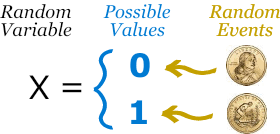
The data in statistical data analysis is basically of 2 types, namely, continuous data and discreet data. The continuous data is the one that cannot be counted. For example, intensity of a light can be measured but cannot be counted. The discreet data is the one that can be counted. For example, the number of bulbs can be counted.
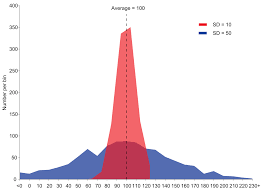
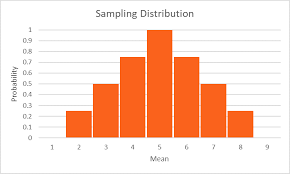
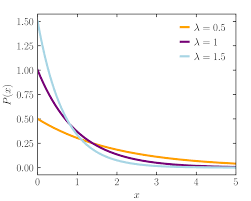
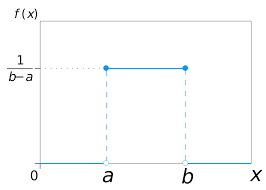
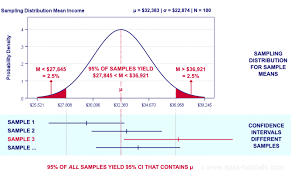
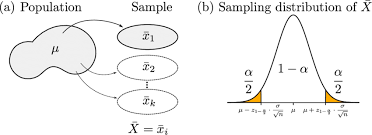
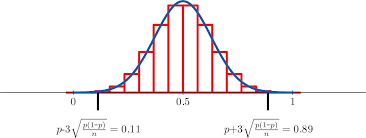
The continuous data in statistical data analysis is distributed under continuous distribution function, which can also be called the probability density function, or simply pdf.
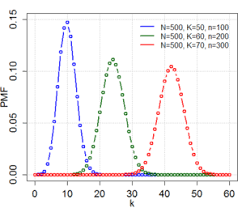
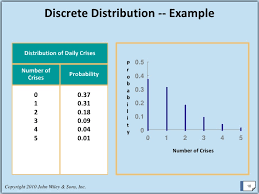
The discreet data in statistical data analysis is distributed under discreet distribution function, which can also be called the probability mass function or simple pmf.
We use the word ‘density’ in continuous data of statistical data analysis because density cannot be counted, but can be measured. We use the word ‘mass’ in discreet data of statistical data analysis because mass cannot be counted.
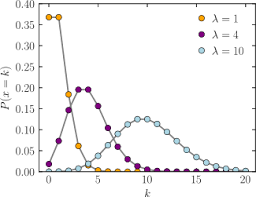
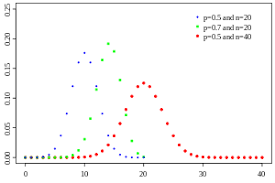
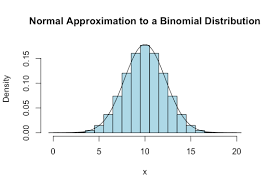
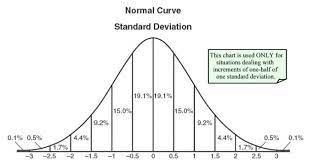
There are various pdf’s and pmf’s in statistical data analysis. For example, Poisson distribution is the commonly known pmf, and normal distribution is the commonly known pdf.
These distributions in statistical data analysis help us to understand which data falls under which distribution. If the data is about the intensity of a bulb, then the data would be falling in Poisson distribution.
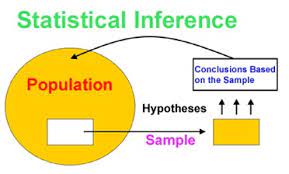
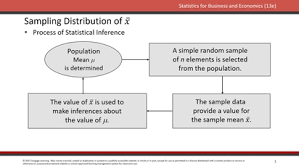
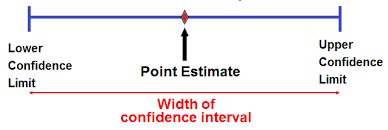
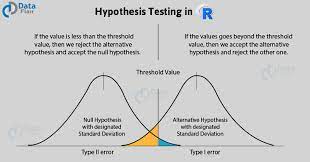
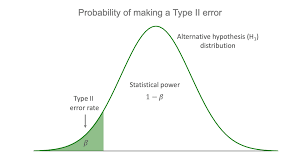
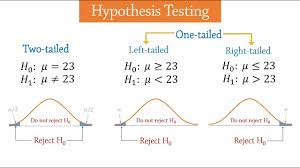
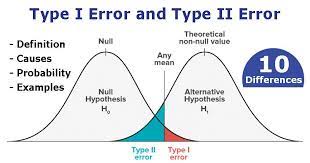
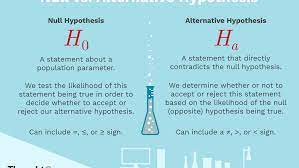
There is a major task in statistical data analysis, which comprises of statistical inference. The statistical inference is mainly comprised of two parts: estimation and tests of hypothesis.
Estimation in statistical data analysis mainly involves parametric data—the data that consists of parameters. On the other hand, tests of hypothesis in statistical data analysis mainly involve non parametric data— the data that consists of no parameters.
30 Aug 2021
30 Aug 2021
31 Aug 2021
31 Aug 2021
30 Aug 2021
28 Aug 2021