By the end of this chapter, you should
- Understand the importance of measuring internal market strength
- Understand what is meant by market breadth
- Be familiar with how the advance-decline line measures market breadth
- Be familiar with how up and down volumes relate to market strength
- Be familiar with how new high and new low statistics measure market strength
- Be familiar with the relationship between the number of stocks above their historical moving average and market strength
In the previous chapter, we looked at the importance of market player sentiment in determining potential market trends. In addition to measuring the attitudes of market players, the technical analyst needs to look at the internal strength of a market. By looking at data specific to each market, the analyst determines whether the internal strength of the respective market is improving or deteriorating. In this chapter, we examine how the analyst looks at market data such as the number of stocks advancing and declining, the volume of the winners and losers, the new 52-week highs and lows, and the position of the averages relative to moving averages. These measures help to gauge the stock market’s underpinnings. The data needed to calculate the indicators studied in this chapter is publicly available in most financial newspapers.
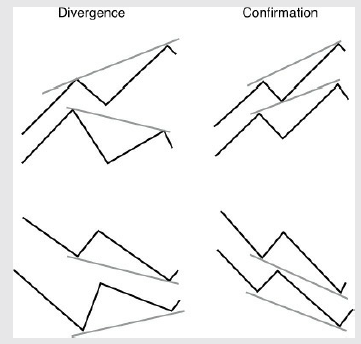
Box 8.1 W hat is a Divergence?
The most important technical concept for confirmation of a trend is called a divergence. As long as an indicator—especially one that measures the rate of change of price or other data (called momentum)—corresponds with the price trend, the indicator is said to “confirm” the price trend. When an indicator or oscillator fails to confirm the trend, it is called a negative divergence or positive divergence, depending on whether peaks or bottoms, respectively, fail to confirm price peaks or bottoms. A divergence is an early warning of a potential trend change. It means the analyst must watch the price data more closely than when the indicators and oscillators are confirming new highs and lows. Divergence analysis is used between almost all indicators and prices; a divergence can occur more than one time before a price reversal.
As an example, one of the tenets used in analyzing trading volume is that in a rising trend, volume should expand with the price rise. If at a new short-term peak in prices the trading volume fails to expand above its earlier, time-equivalent high, a negative divergence has occurred that should warn the analyst that the new price high is occurring on less enthusiasm, as measured by volume, and that the uptrend may soon be ending.
It should be noted that knowledge of a wide array of technical indicators does not make an analyst valuable or cause him to profit, but knowing when to apply which indicator does. Because it is almost impossible to understand all indicators, the technical analyst should select just a few and study them intently.
When looking at indicators, the analyst is generally looking for confirmation or divergence. Confirmation occurs when prices are rising and these indicators rise, signaling strong market internals. Confirmation also occurs when falling prices are accompanied by an indication of weak market internals. In other words, confirmation occurs when price movement and market internals appear to agree.
When a market indicator does not support the direction of price movement, the analyst has a strong warning that the trend may be in the process of reversing. This lack of confirmation is referred to as a divergence.
One quick example is an indicator called the rate of change indicator (ROC). It is merely a plot of the ratio or difference between today’s closing price and the closing price at some specified time in the past, such as 20 days. When the market or stock is hitting a new high and the 20-day ROC is hitting a new high, we have a confirmation of the price action. Should the ROC not be hitting a new high at the same time as the market or stock, we have a negative divergence, a warning that the upward momentum in price is slowing down.
There is another type of divergence called a reversal suggested by Constance Brown (1999). This occurs when the oscillator or indicator, in a positive reversal, reaches a second low that is not confirmed by another new low in prices. The opposite, the negative reversal, occurs when the oscillator reaches a new high but prices do not. Both cases are just variations of a divergence, and as in a normal divergence, each occurrence signals a potential change in market direction.
Source: Kirkpatrick II Charles D., Dahlquist Julie R. (2015), Technical Analysis: The Complete Resource for Financial Market Technicians, FT Press; 3rd edition.
7 Jul 2021
7 Jul 2021
7 Jul 2021
7 Jul 2021
6 Jul 2021
7 Jul 2021