A breakout occurs most often when a price “breaks out” through a prior support or resistance level or zone. A breakout often but not always signals that a significant change in supply and demand has occurred and that a new price trend is beginning. For this reason alone, a breakout is an extremely important signal to the investor or trader. A breakout can also occur at a trend line, which as the previous chapter noted, is just a moving support or resistance level. A breakout in the direction of the previous trend is a confirmation that the trend still exists, and a breakout in the opposite direction of a previous trend suggests that the trend is reversing and that a position should be closed and possibly reversed. Breakouts occur when prices pass through specific levels. Because these levels are often somewhat unclear zones and because false breakouts are common, the point at which a breakout occurs is extremely important. Often there must be a trade-off between speed and conviction. Speed of action is necessary just as a price breaks a level, and conviction is necessary to be sure that the breakout is real. There are a number of ways to accomplish both, but there is always the trade-off between risk and reward. Requiring more conviction that the breakout is real reduces the potential reward, and speed, although potentially more profitable, increases the risk that the breakout is false.
1. How Is Breakout Confirmed?
The first requirement for a breakout is a penetration of a trend line, or support or resistance zone. The next requirement is confirmation that the penetration is a real breakout, not a false one.
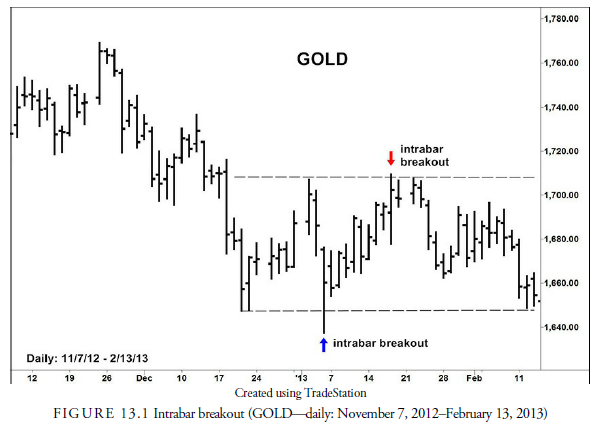
When the exact breakout level is not clear, as in a support or resistance zone, the extreme level of the zone is considered the breakout level. For example, in a trading range with a wide support zone of horizontal lines from previous support points, the lowest support line would be the breakout level. The other horizontal lines are also parts of the zone, but prices will often recede into the support zone without breaking through it entirely. Thus, a break of the lowest support point is evidence that the entire support zone has been penetrated. A trend line is a more definite breakout level because it is a line, but even with a trend line, a false breakout often occurs and requires redrawing of the trend line. In both these instances, a penetration of the breakout level or trend line requires confirmation. Penetrations often occur on an intrabar basis, and then the price closes back on the nonbreakout side of the breakout level or trend line. For an example of an intrabar penetration, see Figure 13.1, a trading range with two false, intrabar breakouts—one up and one down. Penetrations of this type are usually false.
2. Close Filter
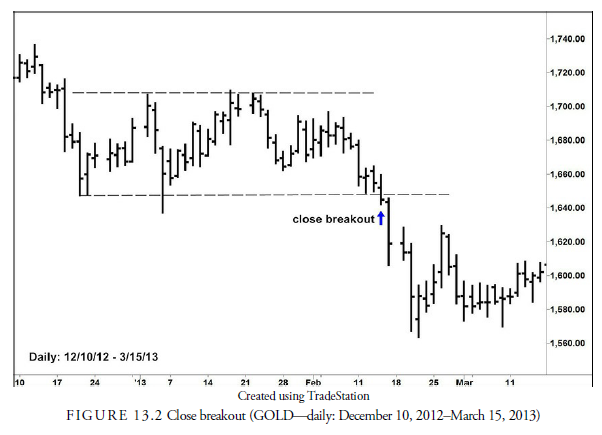
The major problem from the analyst’s standpoint is that when the penetration is occurring, there is usually no other confirming evidence until after the close of trading. Some analysts will act immediately on the penetration and wait for the confirmation later. This is dangerous because the odds of a false breakout are greater with just an intrabar penetration, but the entry can be protected with a nearby stop. The less risky action is to wait for confirmation of the closing price to see if, perhaps, the penetration was just temporarily due to an intrabar exogenous occurrence that had little longer-term meaning. If the price closes on the nonbreakout side of the breakout level, it is plain that the intra-day penetration was likely false and new lines might have to be drawn to account for it. On the other hand, if the closing price is through the breakout level, the odds are higher that the breakout is real. Figure 13.2 shows the same prices as Figure 13.1 but advances time a few weeks to show when the true breakout occurred with a closing price below the support line.
Some traders even wait for two bar closes beyond the breakout level for confirmation. This increases the risk that some part of the move subsequent to the breakout will be missed; on the other hand, it increases the possibility that the breakout is real.
3. Point or Percent Filter
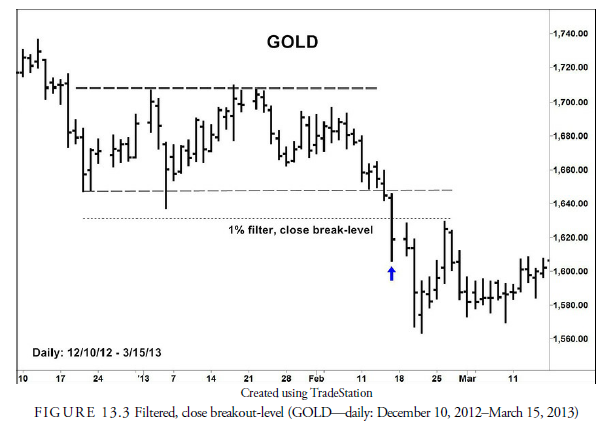
Another confirmation method is to establish a breakout zone either a certain number or fraction of points or a percentage beyond the breakout level, as pictured in Figure 13.3, where both a filter and a close are required for a breakout. The theory in using a filter is that if the price can penetrate the breakout level and a prescribed zone beyond it, the penetration must be real. The number of points or percentage is determined before the penetration and is helpful in computerized models where a definite breakout price needs to be established. Waiting for the close after an intrabar breakout is more difficult to program. The number of points or percentage can be arbitrarily or empirically derived. Although the signal can use any percent or number of points, the most commonly used is a 1-3% rule, a level 1-3% from the ideal breakout point.
4. Time
Rather than looking simply at price, this method looks at time since the penetration. The basis is that if the penetration remains outside the breakout zone for a certain time, it must be real. The usual time period is two bars, but it can be any length of time. The price must remain beyond, or at least close beyond, the breakout level for the required number of bars. A combination of the time rule and the close rule uses both rules. This method requires a penetration and close beyond the breakout level, and then a second bar in which the price penetrates even further beyond the breakout level. For example, in a breakout down, the close must be below the breakout level, and the next bar must have a trade below the previous bar’s low for confirmation of the breakout down. Figure 13.3 qualifies as a two-bar breakout with or without the filter or close constraint.
5. Volume
Increased volume of trading often occurs with a breakout. Heavier trading demonstrates that other market players are acting in the direction of the new trend and that there is sufficient power behind the penetration. Jiler (1962), however, observes, and cannot explain why, that volume can dramatically decline on a breakout, and the breakout is still valid. Usually, however, volume increases as the trend develops. In Chapter 15, “Bar Chart Patterns,” we look at volume behavior on the breakouts from different chart patterns.
6. Volatility
All of the preceding price rules have obvious drawbacks. The principal drawback to most of these methods is that they don’t account for the price volatility of the security. By nature, some securities tend to be characterized by more volatile trading; for these a more significant price move can be expected without it signaling a breakout. Remember that a filter using just the close doesn’t require that the close be any distance from the breakout level. In highly volatile stocks, for example, the close can vary from a trend line or breakout level by a considerable amount and still not be a valid breakout.
A filter rule that uses some arbitrary point or percentage rule is likely to be broken by a highly volatile security before a true breakout occurs. In this case, analysts may consider the price volatility of the security when determining what the filter for a legitimate breakout should be. Three means of calculating volatility are most often used; these are beta, standard deviation of price, and average true range (ATR).
Beta is a calculation of the volatility of a security relative to a market proxy, usually the S&P 500. It is not useful in commodities because commodities have little useful correlation to the stock market or a commodity average. Indeed, beta’s use has diminished over the years, as the underlying assumption that it is a valid measure of risk has been questioned. It does have one advantage in that it eliminates the trend of the market from the volatility calculation.
Standard deviation of returns, based on the percentage change in price, is the basis for most option and other derivative models and uses the complete set of prices over some past period in time. Its usefulness as a breakout filter is diminished by the fact that its value is influenced by the underlying trend of the security. The breakout filter must use the volatility about the trend and not include the trend itself. Otherwise, a strongly trending stock with little volatility about its trend would have a higher filter than a flat-trending stock with wide fluctuations about its mean.
Average true range (ATR) is a derivation of the average range, which is just the average of the difference between each bar high and low over some past period. The ATR is calculated using a special formula devised by Wilder himself to reduce the effects of older data (see Chapter 14, “Moving Averages”). The ATR is an average of the true range of each bar (Wilder, 1978). It includes whatever effect a price gap between bars might have on the security’s volatility. The true range is the greatest of
- The difference between the current bar high and low
- The absolute value of the difference between the prior bar close and the current bar high
- The absolute value of the difference between the prior bar close and the current bar low
The ATR is the average of the true range over some time period. Being dependent solely on the price of the security, the ATR is not influenced by any other average or security and is, thus, pure to the security’s own action. It includes the recent trend only so far as the trend has had an effect on the range of prices. ATR is an excellent measure of volatility and is used in many indicators as well as breakout and stop-loss formulas.
As a price filter for confirmation of a breakout, by including a multiple of the ATR, the breakout level is adjusted for the volatility of the security. As you can see in Figure 13.4, an ATR filter expands and contracts over time as price volatility changes. For example, if price volatility increases, daily true ranges will expand, and the ATR will be larger, making it less likely to have a false breakout due to the increased price volatility. This means that a highly volatile security will have a wider filter to reduce its likelihood of making a false breakout just because of its higher volatility. On the other hand, a dull security that has few wild moves will have a narrow filter that will trigger the breakout with only a minimum deviation from its usual range.

7. Pivot Point Technique
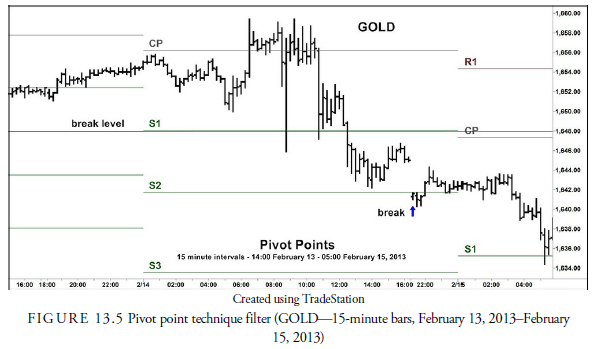
The pivot point technique is a method of determining likely support and resistance levels. It is widely used by day traders to establish potential price ranges for the day and rarely used as confirmation for breakouts (see Figure 13.5).
This technique uses the previous period’s high, low, and close to establish support and resistance levels for the current period. Some formulas use the open as well. A series of points called pivot points for the current period are calculated from price points derived from the previous period. In other words, a day trader on a specific day would calculate the pivot points from the action the previous day. The theory behind using this technique is that as time goes on, the effect of past prices on current prices diminishes. Thus, the most recent, previous bar’s action is the best predictor of the current bar’s action.
This technique uses the following formula (Kaufman, 1998):
P (pivot point) = (Previous period: High + Low + Close) ÷ 3
R1 (first resistance) = (2 x P) – previous period Low
S1 (first support) = (2 x P) – previous period High
R2 (second resistance) = (P + previous period: High – Low)
S2 (second support) = (P – previous period: High – Low)
These calculations establish upper and lower levels at which prices are expected to meet resistance or support based on the previous period’s action. Floor traders will then enter or exit trades around these calculated pivot levels. The use of this formula is, of course, questionable because the logic behind it is questionable. The reason that so many intraday price reversals occur at pivot points is likely because so many traders use them, and, thus, they become self-fulfilling. Using 15-minute bars, Figure 13.5 shows intraday the gold price breakdown displayed using daily bars in Figures 13.3 and 13.4. The pivot points are marked, as you can see, for the three days shown, and their labels correspond to the table above. The break level is the same as in the earlier figures and carried forward to these three days. As a swing trader, you would convert to a day trader and be looking for a break below S2 or S3 to execute your short sale. The break did occur on February 14 just after the stock market close at 16:00.
Traders looking for the validity of daily breakouts, on the other hand, will use the previous weekly or month action to establish current expected resistance and support levels; a price break through a current actual resistance or support level would be confirmed if it also broke a pivot resistance or support level. As a method of confirming breakouts, the logic behind their use is a little more solid. The formula is essentially a measure of the previous day’s volatility projected into the following day. Volatility, as we have seen previously, is a useful method for determining accurate breakout confirmations.
Alternative pivot point calculations exist as well as the standard above. Tom DeMark developed a means of predicting support and resistance based on adding the relationship between the open and close price. There are also Woodie’s and Camarilla pivot point formulas and a Fibonacci formula. When all these methods are compared, not one seems to be consistent or accurately estimate future support or resistance levels.
8. Can a Breakout Be Anticipated?
So far, we have looked at ways of confirming a breakout after it has occurred. Is it possible to determine that a breakout is about to occur before it actually does? Sometimes it is possible to anticipate a breakout. Often, volume is a clue that a breakout is about to occur. As we will learn later, volume often accompanies the trend. In other words, an increase in volume with a trend is supportive of that trend. Thus, when prices are oscillating, for example, beneath a resistance zone and volume increases on every small up leg and decreases with every small down leg, the odds favor that the price will eventually break up through the resistance zone because the increased volume expresses increased interest on the buy side.
Prices can also give a hint as to their next directional move. For example, in a trading range, if prices begin to reverse upward at a level slightly above the lower boundary of the range and then reverse downward right at the resistance zone, it indicates that buyers are becoming a little more aggressive with every minor correction and are willing to pay just a little more for the security when it corrects. If this tendency to have slightly rising lows is accompanied by increasing volume on the rallies, the probability of an upward breakout through resistance increases.
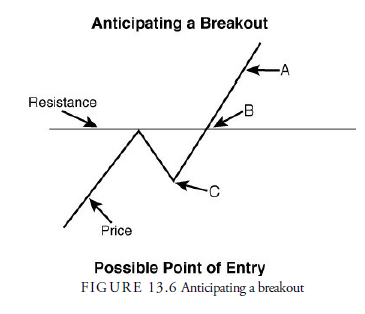
Figure 13.6 gives a hypothetical example of price activity hinting that a breakout may soon occur. Resistance has existed in the past and has stopped the first price rally. A downward reversal takes place to the point marked C. If volume increased on the initial rise to resistance but declined on the correction to C, C becomes a possible entry point in anticipation of a breakout above resistance. This is a low-odds, risky entry point. The chances of its failing to follow with an actual breakout are considerably greater than after an actual breakout has occurred, but the price at which entry is made is lower, and, thus, the trade, if it works out, is potentially more profitable. A trade-off always exists between the higher risk of entry prior to the breakout and the higher reward of a cheaper entry price. At B, assuming again that volume has increased with the small rally, the odds of a breakout have increased over C, but the price is not quite as advantageous. At A, we know that a breakout has occurred, and, thus, our risk of a failure has diminished (but has not been eliminated because false breakouts can still occur), but the price of entry is considerably higher than the other possible entry points. This trade-off between risk and reward is a constant problem for the analyst, and the decision as to which breakout method to use is entirely at the analyst’s discretion, based on individual reward/risk tolerance. Deciding on the most comfortable relation between risk and reward is a problem that will arise in almost every technical situation, from breakouts to money management, and it is one of the reasons that evaluating technical systems is so difficult.
Source: Kirkpatrick II Charles D., Dahlquist Julie R. (2015), Technical Analysis: The Complete Resource for Financial Market Technicians, FT Press; 3rd edition.
7 Jul 2021
7 Jul 2021
7 Jul 2021
8 Jul 2021
7 Jul 2021
7 Jul 2021