The check sheet (see Figure 15.12) is introduced here as the third of the seven tools. The fuel that powers the total quality tools is data. In many companies, elaborate systems of people, machines, and procedures exist for the sole purpose of collecting data. At times, this quest for data has become zealous to the point of obscuring the reason for data collection in the first place. Many organizations are literally drowning in their own data, while at the same time not knowing what is actually going on; they are “data rich and information poor” With the advent of powerful desktop computers, information collection has become an end unto itself in many instances.
Having access to data is essential. However, problems arise when trivial data cannot be winnowed from the important and when there is so much of it that it cannot be easily translated into useful information. Check sheets help deal with this problem.
The check sheet can be a valuable tool in a wide variety of applications. Its utility is restricted only by the imagination of the person seeking information. The check sheet can take any form. The only rules are that data collection must be the equivalent of entering a check mark and that the displayed data must be easily translated into useful information. For example, it may take the form of a drawing of a product with the check marks entered at appropriate places on the drawing to illustrate the location and type of defect. An accounts receivable department might set up a check sheet to record the types and numbers of mistakes on invoices prepared. Check sheets apply to any work environment—not just to the factory floor.
The purpose of the check sheet is to make it easy to collect data for specific purposes and to present it in a way that facilitates conversion from data to useful information. For example, suppose we are manufacturing parts that have a specified dimensional tolerance of 1.120 to 1.130 inches (in.). During the week, each part is measured and the data are recorded. Figure 15.11 is a summary of the week’s results.
This figure contains all the data on shaft length for the week of July 11. Without a lot of additional work, it will be difficult to glean much useful information from this list of data. Imagine how much more difficult it would be if, instead of a table, you were presented with a stack of computer runs several inches thick. That is frequently the case in the information age. (The information age should be called the data age, in our opinion, reflecting the abundance of raw, often meaningless data and the real paucity of useful information.)
The computer could be programmed to do something with the data to make them more useful, and in some
situations, that would be appropriate. After all, computers are good at digesting raw data and formatting the result for human consumption. But before the computer can do that, some human must tell it exactly what it must do, how to format the information, what to discard, what to use, and so on. If we can’t first figure out what to do with the data, no amount of computer power will help. On the supposition that we do know what to do with the data, it is possible that we could preformat the data so that it will be instantly useful as it is being collected. This is one of the powerful capabilities of the check sheet.
The importance of the data in Figure 15.11 rests in reporting how the shafts being produced relate to the shaft length specification. The machine has been set up to produce shafts in the center of the range so that normal variation would not spill outside the specified limits of 1.120 and 1.130 in. and thereby create waste. If the raw data could give us a feel for this as it is being collected, that would be very helpful. We would also like to know when the limits are exceeded. The check sheet in Figure 15.12 has been designed to facilitate both data collection and conversion to information.
The check sheet of Figure 15.12 is set up to accept the data very easily and at the same time display useful information. The check sheet actually produces a histogram as the data are entered. (See the following section for information about histograms.) Data are taken by measuring the shafts, just as was done for Figure 15.11. But rather than logging the measured data by date, as in Figure 15.11, the check sheet in Figure 15.12 only requires noting the date (day of month) opposite the appropriate shaft dimension. The day- of-month notation serves as a check mark, while at the same time keeping track of the day the reading was taken.

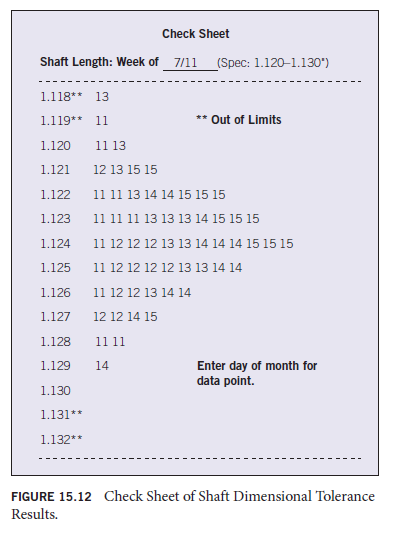
This check sheet should be set up on an easel on the shop floor, with entries handwritten. That will make the performance of the machine continually visible to all—operators, supervisors, engineers, or anyone else in the work area.
The data in Figure 15.11 are the same as the data in Figure 15.12. Figure 15.11 shows columns of sterile data that, before meaning can be extracted, must be subjected to hard work at someone’s desk. Assuming it does get translated into meaningful information, it will probably still remain invisible to the people who could make the best use of it—the operators. That can, of course, be overcome by more hard work, but in most cases, the data will languish. On the other hand, Figure 15.12 provides a simple check sheet into which the data are entered more easily and, once entered, provide a graphic presentation of performance. If the check sheet reveals that the machine is creeping away from the center of the range or if the histogram shape distorts, the operator can react immediately. No additional work is required to translate the data to useful information, and no additional work is required to broadcast the information to all who can use it.
To set up a check sheet, you must think about your objective. In this example, we were making shafts to a specification. We wanted data indicating how well the machine was performing, a graphic warning whenever the machine started to deviate, and information about defects. Setting up the check sheet as a histogram provided all the information needed. This is called a Process Distribution Check Sheet because it is concerned with the variability of a process. Other commonly used check sheets include Defective Item Check Sheets (detailing the variety of defects), Defect Location Check Sheets (showing where on the subject product defects occur), and Defect Factor Check Sheets (illustrating the factors—time, temperature, machine, operator—possibly influencing defect generation).
If we wanted to better understand what factors might be contributing to excessive defects on the shop floor, we could set up a Defect Factors Check Sheet. As an example, go back to the section on Pareto charts and look at Figure 15.6. The top chart there revealed that miswires were the most significant defect in terms of cost. To collect some data about the factors that might be contributing to the miswire defects, a reasonable approach would be to set up a Defect Factors Check Sheet and collect data for a week. We are primarily concerned with the operators themselves and the factors that may influence their performance. The check sheet will list each operator’s number and bench location within the factory. To determine whether the day of the week or the time of day has anything to do with performance, the data will be recorded by day and by morning or afternoon. We could have included tool numbers as well, but using a tool that produces faulty connections is something the operator must guard against. In other words, we will not consider a tool to be at fault—only the operator if he or she continues to use a defective tool.
In the check sheet shown in Figure 15.13, five types of miswire defects, covering all types experienced, are coded by symbols, and these symbols are the only raw data entered on the chart. Sums of all defect categories are shown at the bottom of each column, and the weekly total for each operator is shown at the end of each row. A quick glance at the check sheet points to operators 28 and 33 as the sources of the problem. We don’t know the cause at this point, but we know where to start looking.
In past times, these two people might very well have been summarily fired. In a total quality setting, that decision would be considered the last resort. Most employees want to do a good job and will if they are provided with the necessary resources and training. In a case like this, it is not unusual to find that the fault lies with management. The employees were not adequately trained for the job, or some environmental factor (noise, temperature, lighting, or something else) is at fault, or the operators may simply not be equipped for the task (because of vision impairment, impaired motor skills, or some other problem). In any of those scenarios, management is at fault and, therefore, should do the morally right thing to correct the problem.
Check sheets can be valuable tools for converting data into useful and easy-to-use information. The key is teaching operators how to employ them and empowering them to do so.

Source: Goetsch David L., Davis Stanley B. (2016), Quality Management for organizational excellence introduction to total Quality, Pearson; 8th edition.
Good day very nice site!! Man .. Excellent .. Wonderful .. I’ll bookmark your website and take the feeds additionally?KI am satisfied to find so many useful info right here within the submit, we want develop extra strategies on this regard, thanks for sharing. . . . . .