When students complete their recommendations page with expected costs summed as part of a case analysis, or in actual practice when a firm decides what strategies to pursue at what cost, it is necessary to address the following questions:
- Can the company obtain the needed capital via stock or debt?
- Would common stock, bank debt, corporate bonds, or some combination be better to raise needed capital?
- What would the firm’s projected EPS values be, given securement of the capital and implementation of the strategies?
Successful strategy implementation often requires additional capital beyond net profit from operations or the sale of assets. Two primary sources of capital are debt and equity. Determining an appropriate mix of debt and equity in a firm’s capital structure is an important strategy- implementation decision. Earnings per share/earnings before interest and taxes (EPS/EBIT) analysis is the most widely used technique for determining whether debt, stock, or a combination of the two is the best alternative for raising capital to implement strategies. This technique involves an examination of the impact that debt versus stock financing has on earnings per share (EPS) under various expectations for EBIT, given specific recommendations (strategies to be implemented).
Theoretically, an enterprise should have enough debt in its capital structure to boost its return on investment by applying debt to products and projects earning more than the cost of the debt. In low-earning periods, too much debt in the capital structure of an organization can endanger stockholders’ returns and jeopardize company survival. Fixed debt obligations generally must be met, regardless of circumstances. This does not mean that stock issuances are always better than debt for raising capital. When the cost of capital (interest rates) is low, debt may be better than stock to obtain capital, but the analysis still must be performed because high stock prices usually accompany low interest rates, making stock issuances attractive for obtaining capital. Some special concerns with stock issuances are dilution of ownership, effect on stock price, and the need to share future earnings with all new shareholders.
Another popular way for a company to raise capital is to issue corporate bonds, which is analogous to going to the bank and borrowing money, except that with bonds, the company obtains the funds from investors rather than banks. Especially when a company’s balance sheet is strong and its credit rating excellent, issuing bonds can be an effective, and certainly an alternative way to raise needed capital. In 2014, companies around the world issued more than $1 trillion in corporate bonds, more than 4 percent higher than the prior year. Thus, even with high stock prices, the low interest rate environment enticed companies to increasingly use debt to (1) finance growth, (2) pay dividends, and (3) buy back their own stock (called treasury stock). In fact, in 2014, companies sold corporate bonds at the fastest pace ever, led by Apple, Numericable Group (a French firm), Oracle, Petrobras, Cisco, and Bank of America. Twitter recently raised $1.5 billion by offering convertible bonds in two chunks of $650 million. The word convertible means the bonds can be converted into shares of stock in some cases. Companies lately have been flocking to the convertible bond market to raise cash, as many investors look for less volatility in their investments. Medtronic, the Minneapolis medical-device-maker, recently eclipsed even Apple’s $12 billion bond sale and Alibaba’s $8 billion bond sale. Medtronic raised $17 billion selling bonds, enabling the company to finance its $43 billion purchase of Ireland’s Covidien PLC. Companies are selling bonds at a hectic rate in order to finance strategies at low interest rates, since rates are expected to climb in 2016-2017.
Before explaining EPS/EBIT analysis, it is important to know that EPS is earnings per share, which is net income divided by number of shares outstanding. Another term for shares outstanding is shares issued. In addition, know that the denominator of EPS is reduced when a firm buys its own stock (treasury stock), thus increasing the overall EPS value. Also know that EBIT is earnings before interest and taxes, or as it is sometimes called, operating income. EBT is earnings before tax. EAT is earnings after tax.
The purpose of EPS/EBIT analysis is to determine whether all debt, all stock, or some combination of debt and stock yields the highest EPS values for the firm. Earnings per share is perhaps the best measure of success of a company, so it is widely used in making the capital acquisition decision. It reflects the common “maximizing shareholders’ wealth” overarching corporate objective. By chance if profit maximization is the company’s goal, then in performing an EPS/EBIT analysis, you may focus more on the EAT row than the EPS row. Large companies may have millions of shares outstanding, so even small differences in EPS across different financing options can equate to large sums of money saved by using that highest EPS value alternative. Any number of combination debt/stock (D/S) scenarios, such as 70/30 D/S or 30/70 D/S, may be examined in an EPS/EBIT analysis. The free Excel template at www.strategyclub.com can enable easy calculation of various scenarios of financing options.
Perhaps the best way to explain EPS/EBIT analysis is by working through an example for the XYZ Company, as provided in Table 8-4. Note that 100 percent stock is the best financing alternative as indicated by the EPS values of 0.0279 and 0.056. An EPS/EBIT chart can be constructed to determine the breakeven point, where one financing alternative becomes more attractive than another. Figure 8-4 reveals that issuing common stock is the best financing alternative for the XYZ Company. As noted in Figure 8-6, the top row (EBIT) on the x-axis is graphed with the bottom row (EPS) on the y-axis, and the highest plotted line reveals the best method.
Sometimes the plotted lines will interact, so a graph is especially helpful in making the capital acquisition decision, rather than solely relying on a table of numbers.
All analytical tools have limitations and EPS/EBIT analysis is no exception. But unless you have a compelling reason to overturn the highest last row EPS values dictating the best financing option, then indeed those highest values along the bottom row should dictate the financing decision, because EPS is arguably the best measure of organizational performance, and thus is the best variable to examine in deciding which financing option is best. Seven potential limitations of EPS/EBIT analysis are here:
- Flexibility is a limitation. As an organization’s capital structure changes, so does its flexibility for considering future capital needs. Using all debt or all stock to raise capital in the present may impose fixed obligations, restrictive covenants, or other constraints that could severely reduce a firm’s ability to raise additional capital in the future.
- Control is a limitation. When additional stock is issued to finance strategy implementation, ownership and control of the enterprise are diluted. This can be a serious concern in today’s business environment of hostile takeovers, mergers, and acquisitions. Dilution of ownership could be a problem, and if so, debt could be better than stock regardless of determined EPS values in the analysis.
- Timing is a limitation.. If interest rates are expected to rise, then debt could be better than stock, regardless of the determined EPS values in the analysis. In times of high stock prices, stock may prove to be the best alternative from both a cost and a demand standpoint.
- Extent leveraged is a limitation. If the firm is already too highly leveraged versus industry average ratios, then stock may be best regardless of determined EPS values in the analysis.
- Continuity is a limitation. The analysis assumes stock price, tax rate, and interest rates are constant during all economic conditions.
- EBIT ranges are a limitation. The estimated EBIT low and high values are estimated based on the prior year, plus the impact of strategies to be implemented.
- Dividends are a limitation. If EPS values are highest for the “all-stock scenario,” and if the firm pays dividends, then more funds will leave the firm due to dividends if the all stock scenario is selected.
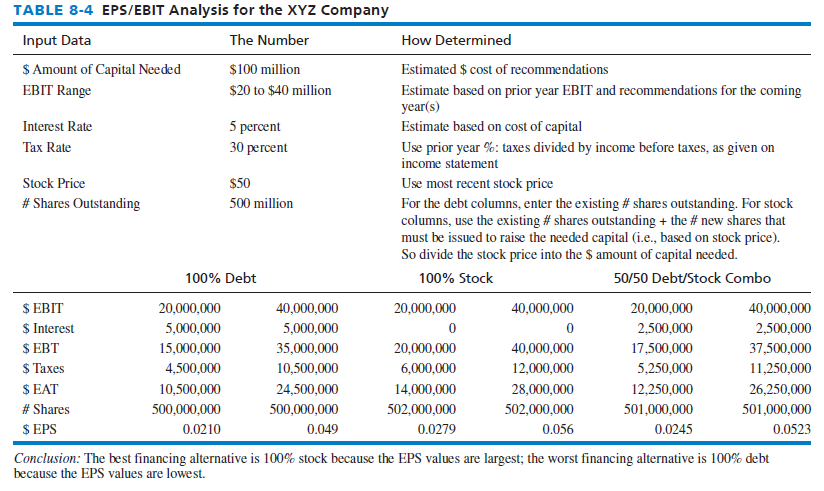
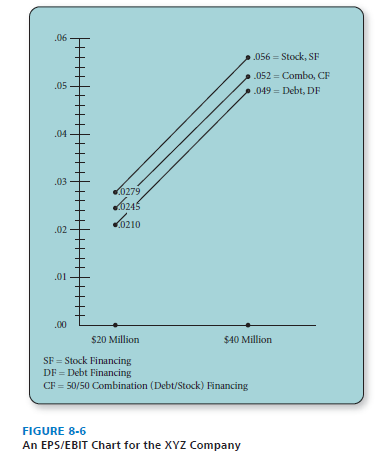
Table 8-5 provides an EPS/EBIT analysis for Boeing Company. Notice in the analysis that the combination stock/debt options vary from 30/70 to 70/30. Any number of combinations could be explored. However, sometimes in preparing the EPS/EBIT graphs, the lines will intersect, thus revealing breakeven points at which one financing alternative becomes more or less attractive than another. The slope of these lines will be determined by a combination of factors, including stock price, interest rate, number of shares, and amount of capital needed. Also, it should be emphasized here that the best financing alternatives are indicated by the highest EPS values. In Table 8-5, the 7 percent tax rates was computed from Boeing’s income statement by dividing taxes paid by income before taxes. Always calculate the tax rate in this manner.
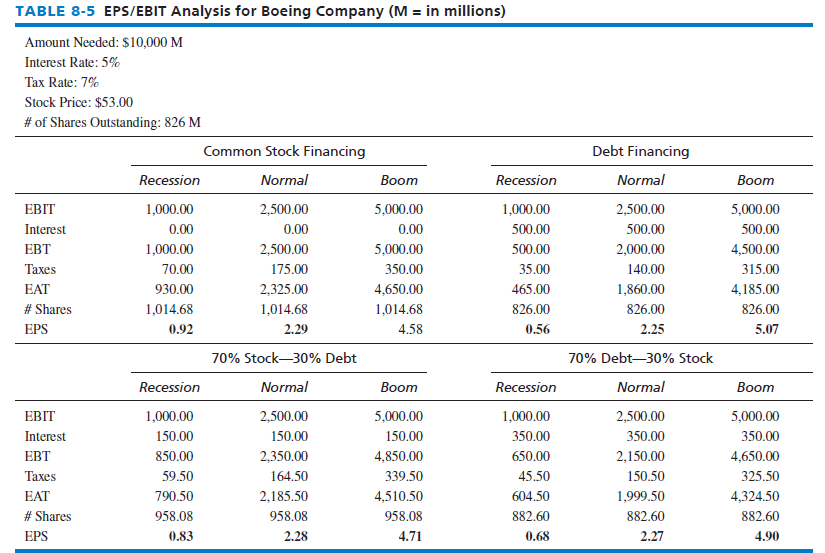
In Table 8-5, note that Boeing should use stock to raise capital in a recession (see 0.92) or in normal (see 2.29) economic conditions but should use debt financing under boom conditions (see 5.07). Let us calculate here the “# Shares” figure of 1,014.68 given under Boeing’s stock alternative. Divide $10,000 M funds needed by the stock price of $53 = 188.68 M new shares to be issued + the 826 M shares outstanding already = 1014.68 M shares under the stock scenario. Along the final row, EPS is the number of shares outstanding divided by EAT in all columns.
Note in Table 8-5 that a dividends row is absent from the Boeing analysis. The more shares outstanding, the more dividends to be paid (if the firm indeed pays dividends). To consider dividends in an EPS/EBIT analysis, simply insert another row for “Dividends” right below the “EAT” row and then insert an “Earnings After Taxes and Dividends” row. Considering dividends would make the analysis more robust.
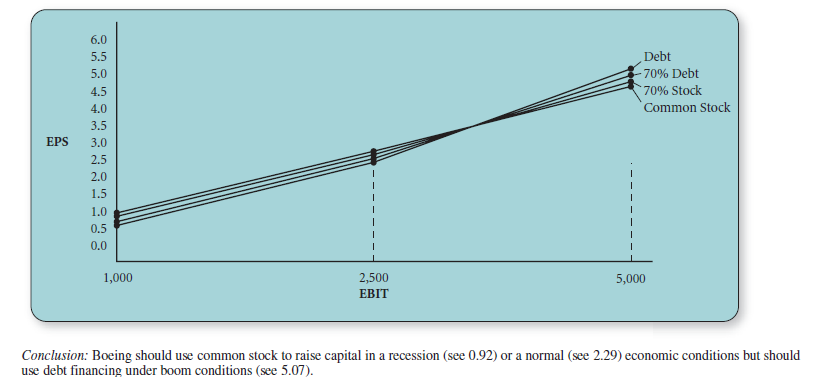
In the Boeing graph, notice that there is a breakeven point between the normal and boom range of EBIT where the debt option overtakes the 70/30 D/S option as the best financing alternative. A breakeven point (where two lines cross each other) is the EBIT level where various financing alternatives represented by lines crossing are equally attractive in terms of EPS. The Boeing graph indicates that EPS values are highest for the 100 percent debt option at high EBIT levels. The graph also reveals that the EPS values for 100 percent debt increase faster than the other financing options as EBIT levels increase beyond the breakeven point. At low levels of EBIT, however, the Boeing graph indicates that 100 percent stock is the best financing alternative because the EPS values are highest.
Source: David Fred, David Forest (2016), Strategic Management: A Competitive Advantage Approach, Concepts and Cases, Pearson (16th Edition).
18 May 2021
17 May 2021
18 May 2021
17 May 2021
18 May 2021
18 May 2021